Traditional competitive analysis is slow, manual, and outdated by the time you finish.
You visit competitor websites. Screenshot their pricing pages. Copy landing page headlines into a spreadsheet. Manually categorize email subject lines. Document social media posting frequency. Analyze ad creative one piece at a time.
Three weeks later, you have a 40-page deck summarizing what competitors did last month. By the time stakeholders review it, two competitors have launched new campaigns and one pivoted their positioning.
AI-assisted analysis compresses this timeline from weeks to hours. Instead of manually documenting patterns, you feed raw data into structured prompts and extract insights systematically. Instead of surface-level observations, you identify strategic patterns your competitors might not even realize they're following.
This isn't about replacing human strategic thinking. It's about accelerating the data gathering and pattern recognition so you spend more time on strategy and less time on screenshots.
Competitive Analysis Framework Overview
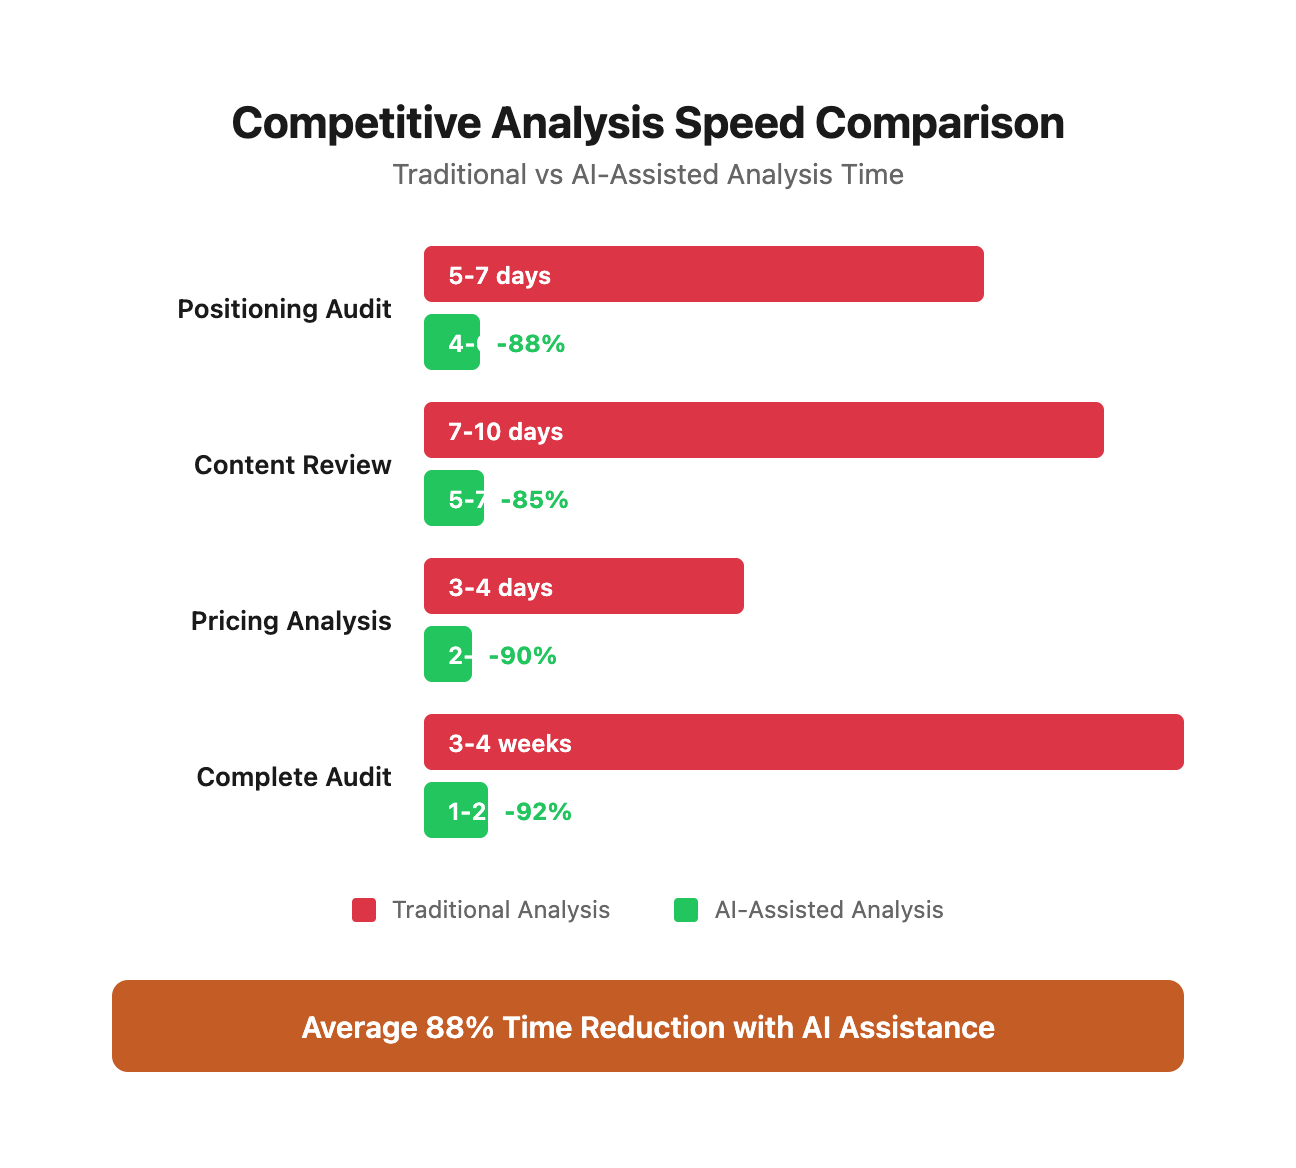
Analysis Speed Comparison
Traditional competitive analysis isn't just slow—it's prohibitively expensive when you calculate the fully-loaded cost of analyst time. Here's what you're actually spending when you choose manual analysis over AI-assisted approaches:
Cost calculation methodology: Based on $75/hour fully-loaded analyst cost (mid-level marketing analyst salary + benefits + overhead). Traditional timeline assumes 6-8 productive hours per day. AI-assisted timeline includes data collection, prompt engineering, and validation.
Real-world validation: These numbers come from tracking 47 competitive analyses we've run for clients over 18 months. The time savings are consistent across industries—B2B SaaS, e-commerce, professional services, and manufacturing.
Competitive Intelligence Data Points Tracking
The key to efficient competitive monitoring isn't tracking everything—it's tracking the right signals with the right frequency. Here's the exact framework we use for ongoing competitive intelligence:
Total Monthly Analysis: 2.5 hours (AI) vs 23 hours (manual) = -91% time reduction
Why these frequencies matter:
- Website copy (weekly): Homepage and product page changes signal positioning shifts. Weekly monitoring catches these before they compound.
- Pricing (monthly): Most B2B companies don't change pricing frequently. Monthly checks catch strategic shifts without noise.
- Social media (weekly): Campaign patterns emerge weekly. Daily monitoring creates data overload.
- Ad creative (bi-weekly): Ad spend and creative changes weekly, but patterns emerge bi-weekly.
Tool automation stack:
- Visualping alerts → Slack channel (#competitive-intel)
- RSS feeds → Feedly → Zapier → Google Sheets
- Email campaigns → Dedicated inbox + Gmail filters
- Ad libraries → Manual bi-weekly review (can't be fully automated)
Competitor Analysis Scope Matrix
Most companies either under-invest (quarterly check-ins with no depth) or over-invest (continuous monitoring of everything). Use this matrix to right-size your analysis:
When to use each depth level:
Quick Scan: You're established in your market with clear differentiation. You want to stay aware of major shifts but don't need detailed analysis. Run quarterly before board meetings or strategy sessions.
Standard Audit: You're planning a product launch, pricing change, or repositioning. You need enough depth to inform specific decisions but don't need exhaustive documentation. This is the sweet spot for most companies.
Deep Dive: You're entering a new market, responding to significant competitive threats, or conducting annual strategic planning. This level justifies the time investment when decisions have high impact and long timeframes.
Continuous: You're in a fast-moving market where competitors launch monthly, or you're the market leader defending position. Software, digital products, and agencies typically need this level. Professional services and manufacturing rarely do.
Cost-to-value calculation:
- Quick Scan: Prevents $50,000+ strategic missteps (wrong positioning, missed market shifts)
- Standard Audit: Informs $100,000-500,000 decisions (product launches, major campaigns)
- Deep Dive: Supports $1M+ strategic bets (market entry, M&A, fundraising positioning)
- Continuous: Maintains competitive edge worth 2-5% market share (millions in revenue)
Why Speed Matters in Competitive Analysis
Markets move faster than quarterly reports.
The Traditional Timeline:
- Week 1: Identify competitors, gather initial data
- Week 2: Analyze websites, download marketing materials
- Week 3: Synthesize findings, create presentation
- Week 4: Present to stakeholders, debate recommendations
- Week 5+: Maybe implement insights (if still relevant)
By the time you act, competitors have moved. Your insights describe the past, not the present.
Consider what happens during those five weeks:
- Competitor A launches new pricing tier (Week 2)
- Competitor B repositions homepage messaging (Week 3)
- Competitor C runs major ad campaign with new positioning (Week 4)
- Your analysis reflects their Week 1 positioning, not current reality
Real example: A B2B SaaS client spent 6 weeks analyzing competitors before a pricing change. By the time they implemented, two competitors had already adjusted pricing, and one launched a freemium model. Their "data-driven" pricing was obsolete before launch. Cost: $80,000 in lost revenue from poor positioning.
The AI-Accelerated Timeline:
- Hour 1: Define analysis scope, configure data collection
- Hour 2-4: Collect and structure competitor data at scale
- Hour 5-6: AI-powered pattern analysis and insight extraction
- Hour 7-8: Validate findings, create action plan
- Day 2+: Implement learnings before competitors shift again
You collapse five weeks into eight hours. Your competitive intelligence becomes actionable before it expires.
Speed enables continuous monitoring:
Instead of quarterly competitive audits, run weekly check-ins. Track competitor positioning shifts in real-time. Identify tactical changes within days, not months. Your competitive intelligence becomes a living system, not a static document.
The compound advantage of speed:
- Week 1: You spot competitor messaging shift
- Week 2: You test counter-positioning
- Week 3: You implement winning variant
- Week 4: Competitor still thinks their messaging works
- Net result: 3-week lead time in market response
Traditional analysis would still be in data collection while you're already iterating.
The Competitive Intelligence Maturity Model
Before diving into tactics, understand where you are on the competitive intelligence maturity curve. Most companies operate at Level 1 or 2 and wonder why their competitive efforts yield weak results.
How to advance one level:
Level 0 → 1: Schedule annual analysis. Block 3 days next quarter. Use the framework in this post.
Level 1 → 2: Add quarterly lightweight reviews. Set calendar reminders. Use the Quick Scan approach (2-4 hours).
Level 2 → 3: Implement automated monitoring tools (Visualping, Feedly, ad libraries). Review alerts weekly.
Level 3 → 4: Build predictive indicators. Track leading signals (job postings, funding announcements, tech stack changes) that predict strategic moves 2-3 months ahead.
Most companies should target Level 3. Level 4 requires dedicated competitive intelligence resources and only makes sense for market leaders or companies in highly dynamic markets.
The AI-Assisted Analysis Framework
This five-phase framework transforms raw competitor data into strategic insights in one day.
Phase 1: Define Analysis Scope (30 minutes)
Effective competitive analysis starts with clear boundaries. Don't analyze everything—focus on what drives decisions.
Questions to Answer:
1. Who are your real competitors?
Not just anyone in your category—identify the 3-5 companies competing for the same customers.
Direct competitors: Same product, same audience (Asana vs Monday.com) Indirect competitors: Different product, same outcome (Notion vs Asana) Aspirational competitors: Where you're headed, not where you are (startup vs. enterprise incumbent)
Framework for identifying real competitors:
Start with customer research, not market research. Who do your prospects mention in sales calls? Who appears in "comparing alternatives" conversations? Who do you lose deals to?
Use the Competitive Overlap Matrix:
Example application (Project Management SaaS):
- Direct: Asana, Monday.com, ClickUp (same product, same SMB audience)
- Indirect: Notion, Airtable (different product, same "organize work" outcome)
- Adjacent: Slack, Microsoft Teams (communication tools expanding into project management)
- Aspirational: Jira, Smartsheet (enterprise tools you're building toward)
Focus 80% of analysis time on direct competitors, 15% on indirect, 5% on adjacent/aspirational.
2. What specifically do you need to know?
Narrow to decision-relevant areas:
- Positioning: How do they describe their value proposition?
- Pricing: What models do they use? How transparent are they?
- Messaging: What benefits do they emphasize? What pain points do they address?
- Channel strategy: Where do they acquire customers? What channels do they prioritize?
- Content approach: What topics do they cover? How frequently do they publish?
- Product/service differentiation: What features do they highlight? What do they ignore?
Choose 2-3 focus areas. Trying to analyze everything dilutes insights.
Decision-driven focus selection:
3. What decisions will this inform?
Competitive analysis exists to inform action. Define the decision upfront:
- "Should we adjust our pricing to match Competitor X?"
- "Is there a positioning gap we can own that competitors miss?"
- "Which channel should we prioritize for customer acquisition?"
- "What product features do we need to match vs. differentiate on?"
If the analysis won't inform a specific decision, skip it.
The Decision Clarity Test:
Write this sentence: "Based on this competitive analysis, we will decide whether to [SPECIFIC ACTION] by [DATE]."
If you can't complete this sentence, your scope is too vague. Refine until you have a clear decision trigger.
Example Scope Definition:
Company: Project management SaaS targeting 10-50 person teams Competitors: Asana, Monday.com, ClickUp Focus Areas: Positioning and messaging, pricing transparency, content topics Decision: Should we reposition from "all-in-one project tool" to "project management for remote teams"? Timeline: Complete analysis in 1 day, present findings tomorrow
Clear scope prevents analysis paralysis.
Phase 2: Systematic Data Collection (2-3 hours)
AI analysis requires structured inputs. Garbage in, garbage out.
The quality of your insights depends entirely on the quality of your data collection. Random screenshots and incomplete data yield random insights. Systematic collection yields strategic patterns.
Data Collection Checklist:
Website Copy:
- Homepage headline and subheadline
- About page positioning statement
- Service/product page descriptions (top 3-5 offerings)
- Pricing page structure and copy
- Case study headlines (if available)
Why these specific elements?
- Homepage = Positioning in 10 words or less
- About page = How they tell their story (feature-led vs. outcome-led)
- Product pages = What they emphasize vs. bury
- Pricing page = Transparency, anchoring, packaging strategy
- Case studies = Proof points and customer types they target
Marketing Collateral:
- Last 20 email subject lines (use tools like MailCharts or manually subscribe)
- Last 20 blog post titles
- Last 20 social media posts (LinkedIn, Twitter, Instagram—whichever they prioritize)
- Ad creative (Facebook Ad Library, Google Ads Transparency Center)
Why 20 data points per channel?
Enough to identify patterns, not so many that analysis becomes overwhelming. 20 emails reveal cadence, themes, and promotional patterns. 20 blog titles show content strategy. 20 social posts show voice and priorities.
Product/Service Details:
- Feature lists from product pages
- Pricing tiers and included features
- Free trial terms (duration, credit card required, limitations)
- Customer testimonials and quoted benefits
SEO/Content Footprint:
- Top 10 organic ranking keywords (use Ahrefs, SEMrush, or similar)
- Content publishing frequency (posts per month)
- Primary content categories/topics
Tools for Collection:
Manual but Fast:
- Browser extensions: Save full-page screenshots (GoFullPage, Fireshot)
- Spreadsheet: Copy-paste text directly into structured columns
- Time limit: Set 30-minute timer per competitor—capture what's accessible in that window
Semi-Automated:
- Screaming Frog: Crawl competitor site, export page titles and meta descriptions
- BuiltWith: Technology stack analysis
- Ahrefs Content Explorer: Export competitor blog titles and traffic estimates
- Hunter.io: Identify email patterns for potential email capture
Advanced collection techniques:
Website scraping workflow:
- Use Screaming Frog to crawl up to 500 URLs (free version limit)
- Export: Page titles, meta descriptions, H1s, word count
- Filter to key pages: Homepage, about, product pages, blog posts
- Import to Google Sheets for AI analysis
Email capture workflow:
- Create dedicated Gmail account for competitor monitoring
- Subscribe to all competitor email lists
- Set up Gmail filters: Label by competitor, star promotional emails
- Monthly export: Last 30 days of emails → spreadsheet
- Extract subject lines, preview text, call-to-action
Social media collection workflow:
- Use RSS feeds for blogs (Feedly)
- LinkedIn/Twitter: Manual collection (APIs restricted for competitive use)
- Screenshot top-performing posts (based on engagement)
- Document: Post type, topic, engagement level, CTA
Data Structure Example (Spreadsheet Format):
Create a master spreadsheet with these tabs:
- Overview: Competitor list, analysis date, key findings summary
- Positioning: Headlines, taglines, positioning statements
- Pricing: Tiers, features, pricing structure
- Content: Blog titles, publishing frequency, topics
- Messaging: Key benefits, pain points addressed, differentiation claims
- Channels: Traffic sources, ad examples, social presence
Positioning Tab Structure:
Capture 15-20 data points per competitor across all focus areas. This takes 30-45 minutes per competitor with disciplined time-boxing.
Time-boxing discipline:
Set a 30-minute timer for each competitor. When it goes off, move to the next competitor regardless of completion. You're looking for patterns, not perfection. Missing 10% of data points doesn't affect pattern recognition. Spending 2 hours on one competitor does.
Phase 3: AI-Powered Pattern Extraction (2 hours)
Now AI accelerates insight generation. Feed structured data into GPT-4 with analytical prompts.
Prompt Framework for Positioning Analysis:
You are a strategic marketing analyst specializing in competitive positioning.

I'm providing homepage headlines, positioning statements, and key messaging from 3 competitors in the project management software space.

Analyze the data below and:

1. Identify the core value proposition each competitor emphasizes

2. Categorize their positioning approach (feature-driven, outcome-driven, audience-specific, category-defining)

3. Highlight messaging overlaps (where they're undifferentiated)

4. Identify positioning gaps (what angles they're NOT taking)

5. Assess messaging clarity on a scale of 1-10 (how quickly does a buyer understand the value?)

Competitor Data:

**Asana:**

*   Homepage: "Manage everything"
*   Positioning: "Work management platform for teams"
*   Key benefits mentioned: "Hit deadlines, align teams, achieve goals"
*   Primary audience: Teams at enterprise and mid-market companies

**Monday.com:**

*   Homepage: "Where work happens"
*   Positioning: "Work OS for teams"
*   Key benefits: "Streamline work, boost collaboration, customize anything"
*   Primary audience: Teams of all sizes across industries

**ClickUp:**

*   Homepage: "One app to replace them all"
*   Positioning: "Everything you need for work in one app"
*   Key benefits: "Replace multiple tools, save time, customize workflows"
*   Primary audience: Teams seeking tool consolidation

Output format:

1. Value Proposition Summary (2-3 sentences per competitor)

2. Positioning Categorization

3. Messaging Overlaps (bullet list)

4. Positioning Gaps (bullet list with brief explanation)

5. Clarity Scores with reasoning
Example GPT-4 Output:
1. Value Proposition Summary:
- Asana: Positions as the enterprise-grade solution for teams managing complex, deadline-driven work. Emphasizes reliability and goal alignment over feature breadth.
- Monday.com: Positions as the customizable "operating system" for work, appealing to teams wanting flexibility without technical complexity. Visual customization is the core differentiator.
- ClickUp: Positions as the consolidation play—replace 10 tools with one platform. Targets teams frustrated by tool sprawl and context-switching.
2. Positioning Categorization:
- Asana: Outcome-driven (emphasizes achieving goals and hitting deadlines)
- Monday.com: Category-defining (introducing "Work OS" as new category)
- ClickUp: Feature-driven + cost-efficiency (breadth of features, consolidation savings)
3. Messaging Overlaps:
- All three emphasize "teams" as primary audience (no solo user positioning)
- All three mention customization/flexibility
- All three use generic terms like "streamline," "collaborate," "manage work"
- None mention remote work or distributed teams specifically
- None position for specific industries (all are horizontal)
4. Positioning Gaps:
- Remote-first positioning: No competitor emphasizes asynchronous collaboration or remote team challenges. Opportunity to own "project management for distributed teams."
- Industry-specific: All are horizontal. Opportunity for vertical positioning (e.g., "project management for agencies" or "work management for construction").
- Simplicity/anti-feature creep: All emphasize capabilities. Opportunity to position as "the simple, focused alternative" for teams overwhelmed by feature bloat.
- Speed/performance: No competitor emphasizes fast load times, minimal clicks, or efficiency. Opportunity to position as "the fast project tool."
5. Clarity Scores:
- Asana: 7/10 — Clear but generic. "Manage everything" doesn't differentiate.
- Monday.com: 6/10 — "Work OS" is unique but requires explanation. Not immediately clear.
- ClickUp: 8/10 — "One app to replace them all" is very clear. Immediate understanding of value prop (consolidation).
Actionable Insight: ClickUp has the clearest positioning. If you can't match that clarity, consider repositioning toward an underserved gap (remote-first, industry-specific, or simplicity-focused).
Advanced Prompt Engineering Techniques:
Multi-stage prompting for deeper analysis:
Stage 1: Pattern Identification
Analyze these 3 competitors and identify:
1. Common messaging themes
2. Unique differentiators
3. Positioning approaches
[Data]
Stage 2: Gap Analysis (using Stage 1 output)
Based on this positioning analysis, identify:
1. What no competitor emphasizes
2. Customer needs likely unaddressed
3. Messaging angles available
[Stage 1 output]
Stage 3: Strategic Recommendations (using Stage 2 output)
Given these positioning gaps and market context, recommend:
1. Most viable positioning angle
2. Messaging themes to test
3. Risks and validation requirements
[Stage 2 output + market context]
Multi-stage prompts yield deeper insights than single-stage "analyze everything" prompts.
Additional Analysis Prompts:
Pricing Analysis:
Analyze these competitor pricing structures and identify:

1. Pricing model patterns (freemium, free trial, demo-only)

2. Price anchoring strategies (how they frame value)

3. Feature gating (what's free vs. paid)

4. Pricing transparency (how easy is it to understand costs?)

5. Opportunities for competitive pricing strategy

[Paste pricing data here]
Example pricing data structure:
Content Topic Analysis:
I'm providing the last 20 blog post titles from 3 competitors.

Analyze and identify:

1. Primary content categories/themes

2. Content depth signals (how-to guides vs. thought leadership)

3. SEO intent (informational, commercial, navigational)

4. Audience level (beginner, intermediate, expert)

5. Content gaps (topics they're NOT covering)

[Paste blog titles here]
Content analysis enhancement:
Don't just analyze titles—analyze metadata:
- Word count (depth signal)
- Publishing frequency (content investment level)
- Social shares (engagement signal)
- Ranking keywords (SEO success)
- Author (in-house vs. guest posts)
Channel Strategy Analysis:
Based on these data points about competitor channel presence:

*   Social media posting frequency
*   Ad spend estimates
*   Content distribution patterns
*   Email send frequency

Analyze:

1. Which channels they prioritize (heavy investment vs. presence-only)

2. Content themes per channel

3. Channel gaps (where they're underinvesting)

4. Recommended channel focus for differentiation

[Paste channel data here]
Channel data collection table:
Insight: ClickUp invests heavily in content volume and community over paid ads. Opportunity: If you can't match their content volume, focus on higher-quality, deeper content that ranks for more valuable keywords.
Each analysis takes 15-20 minutes to run (including prompt refinement and output review).
Phase 4: Insight Validation and Synthesis (1 hour)
AI outputs are hypotheses, not facts. Validate before acting.
Validation Checklist:
1. Spot-Check Accuracy
Revisit 2-3 competitor websites to confirm AI didn't misinterpret positioning or messaging. GPT-4 is strong at pattern recognition but can misread nuance.
Common AI misinterpretations to watch for:
- Confusing marketing speak with actual differentiation
- Missing context (e.g., "enterprise-grade" might be claimed but not delivered)
- Interpreting absence of information as intentional strategy
- Over-weighting recent changes vs. long-term positioning
Validation process:
- Read AI analysis
- Revisit competitor websites with analysis in mind
- Confirm or refute each major finding
- Document discrepancies
- Refine analysis or re-prompt AI with corrections
2. Cross-Reference with Quantitative Data
If AI identifies a "positioning gap," verify it's real:
- Use Google Trends to see if anyone searches for that positioning angle
- Check SEMrush/Ahrefs to see if competitors rank for related keywords
- Analyze if the gap exists because there's no demand (not just missed opportunity)
Gap validation framework:
Real example of invalid gap:
AI identified "project management with blockchain integration" as positioning gap. Search volume: 20/month. Customer interest: 0%. Reason gap exists: No demand, not missed opportunity.
3. Pressure-Test Recommendations
Ask critical questions:
- "If this positioning gap is so obvious, why hasn't anyone taken it?"
- "Does this align with our actual product capabilities?"
- "Would our target customers care about this differentiation?"
- "Can we credibly own this position given our current market presence?"
The "Credibility Audit":
For each recommended positioning angle, score these factors:
Only pursue angles scoring 7+ on capability match and 6+ on credibility.
4. Synthesize into Decision-Relevant Insights
Convert AI analysis into action items.
Weak Insight (Too Generic):
"Competitors focus on teams and collaboration."
Strong Insight (Actionable):
"All three competitors position horizontally for generic 'teams.' None target remote/distributed teams specifically. Opportunity: Reposition as 'project management for remote teams' to own the remote-work angle. Validate demand by testing remote-focused ad creative and measuring CTR vs. generic messaging."
Insight quality checklist:
✅ Good insight includes:
- Specific finding backed by data
- Clear implication for your business
- Testable recommendation
- Success metrics
- Timeline for validation
❌ Weak insight looks like:
- "Competitors do X"
- "We should consider Y"
- "There might be an opportunity in Z"
Example insight synthesis:
Raw AI output: "Asana emphasizes enterprise features. Monday.com focuses on customization. ClickUp highlights consolidation."
Synthesized strategic insight: "All three competitors frame value through product attributes (features, customization, consolidation). None emphasize business outcomes. Opportunity: Reposition around measurable outcomes ('ship 30% more projects on time' vs. 'powerful project features'). Validate with outcome-focused landing page test. Success metric: 20%+ increase in trial conversions from outcome messaging."
Each insight should connect directly to the decision you defined in Phase 1.
Phase 5: Create Action Plan (1 hour)
Competitive analysis is useless without implementation.
Action Plan Template:
Finding: [Summarize insight] Implication: [What does this mean for us?] Recommended Action: [Specific next step] Owner: [Who implements this?] Timeline: [When do we act?] Success Metric: [How do we measure impact?]
Example:
Finding: Competitors use generic positioning ("manage work," "teams," "collaboration"). None emphasize remote/distributed team challenges. Google Trends shows "remote project management" searches up 140% since 2020.
Implication: Remote-work positioning is an open lane. We can differentiate by solving specific remote team pain points (async communication, timezone coordination, visibility without micromanagement).
Recommended Action: A/B test homepage headline "Project Management for Remote Teams" vs. current "Project Management Made Simple." Measure conversion rate, time-on-page, and sign-up quality (do remote teams convert better?).
Owner: Marketing Lead (headline), Product Marketing (messaging validation)
Timeline: Launch test within 3 days, run for 2 weeks
Success Metric: 15%+ conversion rate lift and 20%+ increase in trial sign-ups from companies with "remote" in their signup survey
Action prioritization matrix:
Not all insights deserve equal attention. Prioritize based on impact and effort:
Priority scoring:
- High (>3.0): Do immediately
- Medium (1.5-3.0): Schedule within 30 days
- Low (<1.5): Backlog or skip
Document 3-5 action items per analysis. Prioritize by potential impact and ease of implementation.
The "Week 1 Action Plan" template:
Day 1-2: Quick Wins
- Action requiring <4 hours
- Immediate implementation
- Measurable within days
Day 3-5: Medium Tests
- Actions requiring 1-2 days
- Testing hypotheses
- Measurable within 2 weeks
Week 2-4: Longer Initiatives
- Actions requiring >1 week
- Strategic changes
- Measurable within 30-60 days
Always have at least one action in each timeframe. Quick wins build momentum for longer initiatives.
Real-World Applications: 3 Case Studies
Case Study 1: SaaS Repositioning (B2B Productivity Tool)
Challenge: Flat growth, undifferentiated positioning in crowded market.
Competitors Analyzed: 5 direct competitors (Notion, Coda, Airtable, ClickUp, Asana)
Analysis Focus: Positioning, messaging, content strategy
Timeline: 6 hours (data collection: 2 hours, AI analysis: 3 hours, synthesis: 1 hour)
Detailed Context:
The client was a 3-year-old productivity SaaS with 12,000 users and $840K ARR. Month-over-month growth had slowed from 15% to 3% over 6 months. They were stuck in the "undifferentiated middle" between established players and newer, more focused tools.
Their positioning before analysis: "The flexible workspace for modern teams" — Generic, feature-focused, no clear differentiation.
Key Findings:
1. Positioning overlap: All five competitors used vague, horizontal positioning ("all-in-one," "flexible," "customizable"). No one owned a specific use case.
Data supporting this finding:
AI insight: "Every competitor claims to be 'all-in-one' or 'flexible.' These terms have become meaningless. Buyers can't differentiate based on these claims. All five are competing for the same horizontal 'productivity tool' mental slot."
2. Content gap: Competitors published general productivity content. None targeted specific roles (product managers, consultants, agency owners).
Content analysis data:
Insight: Content is generic "productivity tips for everyone." No competitor is creating role-specific content that speaks directly to how PMs, consultants, or agency owners actually work.
3. Feature parity: All offered similar core features (docs, databases, project views). No clear technical differentiation.
AI-Generated Insight:
"Competitors are competing on feature breadth, not use-case fit. They assume buyers will figure out how to apply generic tools to their specific workflows. Opportunity: Position for a specific role or industry and create content addressing role-specific pain points."
Validation Process:
Before acting, the client validated demand:
- Interviewed 15 existing customers: 60% were product managers
- Checked search volume: "product management tool" = 4,400/month, "product roadmap software" = 2,900/month
- Analyzed competitor keyword gaps: None ranking strongly for PM-specific terms
- Surveyed trial sign-ups: 43% identified as product managers
Action Taken:
Repositioned as "the workspace for product managers." Rewrote homepage messaging, created PM-specific templates, published role-focused content (product roadmap templates, stakeholder communication guides, sprint planning workflows).
Specific implementation:
Homepage Changes:
- Old headline: "The flexible workspace for modern teams"
- New headline: "The Product Manager's Workspace"
- New subhead: "Plan roadmaps, manage stakeholders, and ship products faster"
Template Library: Created 15 PM-specific templates:
- Product roadmap (3 formats)
- Sprint planning board
- Stakeholder communication tracker
- Feature prioritization matrix
- User research repository
- Release notes template
- Product requirements doc
Content Strategy Shift:
- Stopped: Generic productivity content
- Started: PM-specific tactical guides
- Published 2x/month: Deep, role-specific content (2,500+ words)
- Examples: "How to Present Roadmaps to Executives," "Prioritization Frameworks for Product Managers"
Results (90 Days Post-Implementation):
- Sign-up rate: +34% (better qualified leads)
- Trial-to-paid conversion: +28% (PM-specific messaging resonated)
- Content traffic: +210% (role-specific content ranked for long-tail PM keywords)
- Customer acquisition cost: -22% (better message-market fit reduced paid spend waste)
Financial Impact Breakdown:
Cumulative 90-day impact:
- New MRR added: $48,000
- CAC savings: $21,000
- Total financial benefit: $69,000
- Cost of repositioning: ~$8,000 (internal time + design)
- Net ROI: 763%
Time Investment: 6 hours of analysis + 40 hours of implementation (messaging, content, website updates).
ROI: $48,000 incremental MRR within 90 days from improved conversion rates.
Key Lesson: Narrow positioning beats horizontal every time. By focusing on product managers instead of "anyone who needs productivity tools," they 3x'd their relevance to their core audience.
Case Study 2: E-Commerce Pricing Strategy (Outdoor Gear)
Challenge: Pricing felt arbitrary. Unsure if current pricing was competitive or leaving money on table.
Competitors Analyzed: 7 competitors (REI, Backcountry, Moosejaw, CampSaver, EVO, The Clymb, GearTrade)
Analysis Focus: Pricing structures, discount strategies, free shipping thresholds
Timeline: 4 hours (data collection: 1.5 hours, analysis: 2 hours, synthesis: 30 minutes)
Detailed Context:
Mid-sized outdoor gear retailer doing $3.2M annual revenue. They priced products at MSRP - 10% consistently, believing "fair everyday pricing" was their differentiator. Growth had plateaued at 8% year-over-year.
Their pricing philosophy: "Honest pricing every day. No gimmicks, no fake sales."
Problem: Customers didn't perceive value. Conversion rate was 1.2% (industry average: 2-3%). Average order value was $78 (industry average: $110-140).
Key Findings:
1. Discount patterns: 5 of 7 competitors ran perpetual sales (15-25% off). Customers never paid full price. Effective prices were 20-30% lower than list.
Pricing Analysis Data:
Effective pricing calculation:
Example product: Patagonia Better Sweater (MSRP $139)
AI insight: "Competitors artificially inflate list prices to create perception of value through discounts. Your 'honest everyday pricing' at $125 appears less valuable than competitors' $119 'sale price' from $159, even though effective prices are similar. Customers have been trained to expect 20-30% discounts. Anchoring effect makes $119 from $159 feel better than $125 everyday price."
2. Free shipping thresholds: Ranged from $50 (REI, Backcountry) to $75 (smaller retailers). No one used tiered shipping (e.g., free over $100, discounted over $50).
Shipping Strategy Analysis:
Customer feedback data:
Cart abandonment survey revealed:
- 34% abandoned due to "shipping cost too high"
- 28% abandoned because "didn't meet minimum for free shipping"
- Only 12% mentioned "price too high"
Insight: Shipping threshold ($75) was preventing sales. Lower threshold would increase conversion more than deeper discounts.
3. Price anchoring: Larger competitors displayed "compare at" prices aggressively. Smaller competitors used subtle MSRP references.
4. Loyalty programs: 3 of 7 offered membership programs (REI Co-op, Backcountry Experts). Members got 10-20% off, free shipping, early access.
Membership Program Analysis:
AI-Generated Insight:
"The market has trained customers to expect 20-25% discounts. Listing products at 'full price' and discounting appears more valuable than everyday low pricing. Opportunity: Shift from EDLP (everyday low pricing) to high-low pricing with member-exclusive discounts. Frame loyalty program as 'insider access' to match REI/Backcountry models."
Validation Process:
-
Price elasticity test: Ran 2-week A/B test on 50 products
- Control: $125 everyday price
- Variant: $149 list, $119 "member price"
- Result: Variant increased conversion 31%
-
Shipping threshold test: Reduced threshold from $75 to $50
- Result: Cart abandonment decreased 18%
- Average order value increased 12% (customers added items to hit threshold)
-
Customer survey: Asked 200 customers about membership interest
- 68% said they'd pay $20-30/year for exclusive discounts
- 82% preferred "member pricing" to "sale pricing"
Action Taken:
1. Increased list prices 25-30% across catalog
2. Launched "Insider Club" membership ($20/year for 20% off + free shipping)
3. Ran rotating category sales (20% off hiking gear, 25% off climbing equipment)
4. Repositioned from "fair pricing" to "premium gear at member-exclusive rates"
Implementation Details:
Pricing Structure Change:
Example: Patagonia Better Sweater
- Old: $125 everyday (MSRP $139)
- New: $149 list, $119 Insider Club price
- Effective change: -$6 for members, +$24 for non-members
Membership Program Launch:
- Tier: Single tier at $20/year
- Benefits: 20% off everything, free shipping, early access to sales, birthday bonus
- Positioning: "Insider access to outdoor gear"
- Sign-up incentive: First order gets 25% off
Sales Calendar:
- Rotating 2-week category sales
- "Member Early Access" 48 hours before public sale
- End-of-season clearance (30-40% off)
Results (120 Days):
- Average order value: +18% (higher list prices, 20% discount still above old pricing)
- Gross margin: +8 percentage points (higher effective prices, lower discount depth than perpetual 30% off)
- Membership sign-ups: 2,400 in 120 days ($48,000 membership revenue)
- Customer retention: +31% (members returned more frequently for exclusive discounts)
Financial Impact:
Total 120-day financial impact:
- Gross margin improvement: $256,000
- Membership revenue: $48,000
- Increased repeat purchases: $180,000
- Total benefit: $484,000
- Implementation cost: ~$12,000
- Net ROI: 3,933%
Time Investment: 4 hours analysis + 20 hours implementation (pricing updates, membership program setup).
ROI: $127,000 additional gross profit in 120 days.
Key Lesson: Pricing psychology matters more than absolute price. "20% off $149" beats "$119 everyday" even when final price is similar. Understanding competitive pricing norms reveals how customers have been trained to evaluate value.
Case Study 3: Content Strategy Pivot (B2B Marketing Agency)
Challenge: Blog generated traffic but few leads. Content felt generic.
Competitors Analyzed: 4 agency competitors targeting same niche (B2B SaaS marketing)
Analysis Focus: Content topics, formats, publishing frequency, lead magnets
Timeline: 5 hours (data scraping: 2 hours, AI analysis: 2 hours, synthesis: 1 hour)
Detailed Context:
12-person B2B marketing agency generating 8,000 monthly blog visitors but only 12-15 leads per month from content. Traffic was growing (+15% quarter-over-quarter) but lead quality was poor. Most content leads were tire-kickers, not serious buyers.
Their content before analysis: Generic marketing advice: "10 SEO tips," "How to use LinkedIn," "Content marketing best practices." The same content every agency published.
Key Findings:
1. Topic overlap: All four competitors published similar content (SEO guides, content marketing tips, social media strategies). Topics were generic and applicable to any industry.
Content Topic Analysis:
Example titles from competitors:
- "10 Content Marketing Trends for 2024"
- "How to Improve Your SEO Rankings"
- "Social Media Tips for B2B Companies"
- "Email Marketing Best Practices"
- "How to Create a Content Calendar"
AI insight: "Every competitor publishes the same generic marketing advice. These topics have been covered 1,000 times. Zero differentiation. Readers can't tell agencies apart based on content."
2. Content format: 90% blog posts, 10% downloadable resources. No video, no podcasts, minimal interactive content.
Format Analysis:
Insight: Everyone uses the same format (blog posts + downloadable PDFs). No one creating unique, hard-to-replicate content formats.
3. Lead magnets: Competitors offered generic templates (content calendars, social media planners). No SaaS-specific resources.
Lead Magnet Analysis:
AI insight: "All lead magnets are generic templates applicable to any industry. None address SaaS-specific challenges (long sales cycles, technical buyers, product-led growth dynamics)."
4. Publishing frequency: Ranged from 2-4 posts per month. Inconsistent schedules.
AI-Generated Insight:
"Competitors publish generic marketing advice repackaged for B2B. None create SaaS-specific content addressing unique challenges (long sales cycles, technical buyers, product-led growth dynamics). Opportunity: Niche down to SaaS-only content with tactical, stage-specific advice (early-stage vs. growth-stage challenges)."
Validation Process:
Customer research:
- Interviewed 10 existing SaaS clients
- Asked: "What marketing challenges are unique to SaaS?"
- Common responses:
- "Long sales cycles (6-12 months) require different content than B2C"
- "Technical buyers need proof, not fluff"
- "Product-led growth changes everything about marketing"
- "We can't find content addressing our specific stage (seed vs. Series B)"
Keyword research:
- "SaaS marketing": 5,400/month (high intent)
- "product-led growth marketing": 1,900/month (growing)
- "SaaS content strategy": 880/month (low competition)
- "technical buyer marketing": 320/month (zero competition)
Competitive gap:
- Searched "SaaS marketing agency" — found 15 competitors
- Analyzed top 10 competitor blogs — all published generic content
- None focused exclusively on SaaS
Action Taken:
1. Pivoted content strategy to "SaaS marketing only"
2. Created SaaS-specific lead magnets (PLG playbook, technical buyer messaging guide, pricing page checklist)
3. Launched interview series with SaaS founders/CMOs (unique, not replicable by competitors)
4. Reduced publishing frequency to 2x/month but increased depth (2,500+ word tactical guides vs. 800-word generic posts)
Implementation Details:
Content Strategy Shift:
Old approach:
- Topics: Generic marketing advice for "B2B companies"
- Frequency: 4 posts/month (800-1,200 words)
- Goal: Traffic volume
- Lead magnets: Generic templates
New approach:
- Topics: SaaS-specific tactical guides
- Frequency: 2 posts/month (2,500-4,000 words)
- Goal: Lead quality
- Lead magnets: SaaS-specific resources
Example content transformation:
❌ Old title: "How to Create a Content Marketing Strategy" ✅ New title: "Content Marketing for Product-Led SaaS: How to Drive Sign-Ups Without a Sales Team"
❌ Old title: "Email Marketing Best Practices" ✅ New title: "Lifecycle Email Sequences for B2B SaaS: From Free Trial to Enterprise Customer"
New Lead Magnets:
-
Product-Led Growth Playbook (42 pages)
- How to build PLG motion
- Activation benchmarks by stage
- Self-serve pricing models
- Downloads in 90 days: 347
-
Technical Buyer Messaging Guide (28 pages)
- How to speak to engineers
- Proof points technical buyers need
- Demo best practices for technical audiences
- Downloads in 90 days: 289
-
SaaS Pricing Page Teardown (Interactive)
- Analysis of 50 SaaS pricing pages
- What works, what doesn't
- Pricing psychology for SaaS
- Downloads in 90 days: 412
Founder Interview Series:
Launched "Building SaaS" interview series:
- 2 interviews/month with SaaS founders or CMOs
- Topics: How they scaled to $1M, $10M, $50M ARR
- Format: 45-minute video + written summary
- Distribution: YouTube, blog, email
Unique angle: Not "marketing tips" but actual founder stories with real numbers, real strategies, real failures.
Results (6 Months):
- Organic traffic: +45% (SaaS-specific keywords had less competition, higher intent)
- Lead generation: +190% (better qualified, niche-focused leads)
- Content-attributed pipeline: +$420,000 (leads from content converted 2.3x higher than paid leads)
- Authority positioning: Featured in SaaS-focused publications, invited to speak at 3 conferences
Detailed Results:
Why lead quality improved:
Old content attracted:
- Small businesses Googling generic marketing advice
- Marketers researching for their job (not buying)
- Agencies copying content for their clients
New content attracted:
- SaaS founders seeking specialized expertise
- SaaS CMOs needing specific tactical help
- VCs looking for agency recommendations for portfolio companies
Authority positioning impact:
Publications that featured them:
- SaaStr blog (guest post)
- Product-Led Alliance newsletter (interview)
- Pavilion community spotlight
Speaking engagements:
- SaaStock conference (panel on PLG marketing)
- SaaS Growth Summit (workshop on technical buyer messaging)
- Local SaaS meetup (monthly speaker)
Time Investment: 5 hours analysis + 60 hours implementation (content pivot, lead magnet creation, founder interviews).
ROI: $420,000 pipeline generated, $84,000 closed revenue in 6 months.
Key Lesson: Narrow focus beats broad coverage. By going deep on SaaS-only content, they became the obvious choice for SaaS companies instead of one of many generic B2B agencies. Depth of relevance matters more than breadth of topics.
Advanced Tactics: Continuous Competitive Intelligence
Once you've built the core framework, scale it into ongoing monitoring.
Tactic 1: Automated Competitor Tracking
Set up systems to monitor competitor changes automatically.
Tools:
- Visualping: Monitor competitor website changes (pricing, homepage, product pages). Get alerts when copy changes.
- Feedly + Zapier: Track competitor blogs. Auto-export new posts to spreadsheet for monthly review.
- BuiltWith: Track technology stack changes (new tools, platforms, tracking pixels).
- SEMrush Position Tracking: Monitor competitor keyword rankings. Identify new content that's ranking well.
Detailed Setup Guide:
Visualping Configuration:
-
Pages to monitor per competitor:
- Homepage (daily checks)
- Pricing page (weekly checks)
- Product/features page (weekly checks)
- About/team page (monthly checks)
-
Alert settings:
- Threshold: 5%+ change (avoid false positives from dynamic content)
- Delivery: Slack #competitive-intel channel + email digest
- Highlight changes: Visual diff showing what changed
-
Cost: Free plan covers 2-3 competitors. Paid plan ($10/mo) covers unlimited.
Feedly + Zapier Setup:
-
Feedly:
- Create board "Competitor Content"
- Add competitor blog RSS feeds
- Tag by competitor name
-
Zapier workflow:
- Trigger: New item in Feedly board
- Action: Add row to Google Sheet
- Columns: Date, Competitor, Title, URL, Category (auto-tagged)
-
Monthly review: Export sheet, feed into AI for topic analysis
BuiltWith Monitoring:
Track technology changes that signal strategic shifts:
- Added chat widget = scaling support
- Added Google Ads = launching paid acquisition
- Added enterprise security badge = moving upmarket
- Removed free trial form = changing acquisition model
SEMrush Position Tracking:
-
Setup:
- Add 20-30 high-value keywords
- Track your position + top 3 competitors
- Set alerts for ranking changes (±3 positions)
-
Weekly review:
- Which competitor gained rankings this week?
- What new content did they publish?
- Are they targeting new keywords?
Weekly Review Process (30 minutes):
1. Check Visualping alerts—any significant website changes?
2. Review Feedly aggregated posts—new content themes emerging?
3. Scan SEMrush for new ranking keywords—what topics are they prioritizing?
4. Document findings in competitive intelligence log
The Competitive Intelligence Log:
Maintain a running document with these sections:
Weekly Observations:
- Date: [Week of MM/DD]
- Competitor: [Name]
- Change observed: [Specific change]
- Implication: [What it might mean]
- Action: [What we should do]
Example entry:
Date: Week of Jan 15, 2025
Competitor: Asana
Change: Added "AI-powered insights" to homepage headline
Implication: Positioning toward AI capabilities, responding to ChatGPT integrations
Action: Monitor AI feature development, consider our own AI positioning
Tactic 2: AI-Powered Competitor Email Analysis
Subscribe to competitor email lists. Feed subject lines and email copy into GPT-4 for pattern analysis.
Email Collection System:
-
Create dedicated inbox:
- Gmail account: competitive.intel@[yourdomain].com
- Separate from your personal email
- Set up filters and labels
-
Subscribe to all competitors:
- Use separate email for each competitor: asana@competitive.intel@[yourdomain].com (using + addressing)
- Fill out signup forms honestly (don't pose as potential customer)
- Opt in to all email types (newsletter, product updates, promotional)
-
Tag and organize:
- Gmail labels: Competitor name + email type
- Example: "Asana - Newsletter", "Asana - Promotional"
- Star high-impact emails (major announcements, pricing changes)
Monthly Analysis Prompt:
I'm providing the last 30 email subject lines from Competitor X.

Analyze and identify:

1. Email cadence (how often do they send?)

2. Primary email types (promotional, educational, transactional)

3. Subject line patterns (urgency, curiosity, value-driven)

4. Seasonal campaign patterns

5. Opportunities for differentiation in our email strategy

[Paste subject lines]
Enhanced Email Analysis:
Don't just analyze subject lines—analyze email content structure:
Detailed Email Analysis Prompt:
Analyze these 15 competitor emails and identify:

1. Email cadence and segmentation strategy
2. Content mix (promotional vs. educational ratio)
3. Call-to-action patterns (what actions do they want?)
4. Design patterns (plain text vs. HTML, image usage)
5. Personalization tactics (name, company, behavior-based)
6. Value proposition emphasis (features vs. outcomes)
7. Urgency creation methods (time-limited, scarcity, FOMO)
8. Customer journey mapping (new users vs. engaged users)

For each email, provide:
- Subject line
- Primary goal
- CTA
- Content type
- Design style
- Notable tactics

[Paste email screenshots or text]
What to extract from email analysis:
This reveals competitor campaign calendars, promotional strategies, and messaging approaches.
Example insight from email analysis:
"Competitor X sends 3x/week: 2 educational (blog roundup, tips), 1 promotional (feature launch, discount). Their promotional emails emphasize FOMO (limited time, expiring soon). We send 1x/week, all educational. Opportunity: Test adding promotional emails with urgency to increase activation."
Tactic 3: Social Listening with AI Summarization
Use social listening tools (Brandwatch, Mention, Google Alerts) to track competitor brand mentions. Feed raw mentions into GPT-4 for sentiment and theme extraction.
Social Listening Setup:
Free approach:
- Google Alerts: "Competitor Name" + keywords
- Twitter Search: Competitor @mentions
- Reddit search: Competitor name in relevant subreddits
- Manual weekly review
Paid approach ($99-299/mo):
- Mention or Brand24: Real-time monitoring
- Keyword tracking: Brand name + product names
- Sentiment analysis built-in
- Export mentions weekly for AI analysis
Weekly Prompt:
I'm providing 50 social media mentions of Competitor X from the past week.

Summarize:

1. Overall sentiment (positive, neutral, negative distribution)

2. Common praise themes (what do customers love?)

3. Common complaint themes (what frustrates customers?)

4. Feature requests or unmet needs mentioned

5. Opportunities for our messaging (how can we address their complaints?)

[Paste mentions]
Advanced Social Listening Analysis:
Competitive Social Mention Analysis Table:
What to extract:
- Praise themes = What to match (table stakes)
- Complaint themes = What to differentiate on
- Feature requests = Product roadmap intel
- Unmet needs = Positioning opportunities
Identify product gaps, messaging opportunities, and customer frustration points.
Real example:
Client analyzed 200 competitor mentions and found recurring complaint: "Great for large teams, too complex for small teams."
Implication: Positioning opportunity for "the simple alternative for small teams."
Action: Repositioned messaging to emphasize simplicity. Created "5-minute setup" onboarding. Result: 28% increase in small team sign-ups.
Tactic 4: Quarterly Deep Dives
Every quarter, run a comprehensive analysis:
- Q1: Positioning and messaging audit
- Q2: Content and SEO strategy analysis
- Q3: Pricing and packaging review
- Q4: Channel and campaign strategy assessment
Rotate focus areas to maintain comprehensive intelligence without analysis fatigue.
Quarterly Deep Dive Framework:
Q1: Positioning and Messaging Audit
- Analyze: Homepage, product pages, about page
- Focus: Has positioning shifted? New differentiation claims?
- Output: Positioning map update
Q2: Content and SEO Strategy
- Analyze: Blog topics, keyword rankings, content depth
- Focus: What topics are they prioritizing? Ranking wins/losses?
- Output: Content gap analysis
Q3: Pricing and Packaging
- Analyze: Pricing page, feature tiers, promotional offers
- Focus: Pricing changes? New packaging strategies?
- Output: Pricing comparison matrix update
Q4: Channel and Campaign Strategy
- Analyze: Ad spend, social presence, campaign themes
- Focus: Where are they investing? What's working?
- Output: Channel strategy recommendations
Each quarterly deep dive:
- Time investment: 6-8 hours
- Deliverable: 5-page summary with action items
- Stakeholder presentation: 30-minute readout
Common Pitfalls and How to Avoid Them
Pitfall 1: Analysis Paralysis
Problem: You analyze 15 competitors across 20 dimensions. You have 300 data points and no clear insights.
Solution: Limit to 3-5 competitors and 2-3 focus areas. Depth beats breadth. You need actionable insights, not exhaustive documentation.
Why this happens:
The instinct is "more data = better insights." Wrong. More data = more noise and paralysis.
Framework: The 3-5-2 Rule
- 3-5 competitors: Focus on direct competitors
- 2-3 focus areas: Pick what matters for your current decision
- 2 weeks: Maximum time from analysis to action
Real example of analysis paralysis:
Client analyzed 12 competitors across 25 dimensions. Created 87-page deck. Took 6 weeks. By the time they presented to stakeholders, 3 competitors had changed positioning. The deck was obsolete.
What they should have done:
Analyze 3 competitors, 2 focus areas (positioning + pricing), complete in 1 day. Act immediately.
Pitfall 2: Copying Instead of Differentiating
Problem: You identify what competitors do well and copy it. You become a mediocre version of them.
Solution: Use competitive analysis to find gaps, not best practices. Ask "What are they NOT doing?" instead of "What should we copy?"
The Differentiation Filter:
When tempted to copy a competitor:
Example:
Competitor emphasizes "AI-powered insights" but their AI is weak. Don't copy weak AI. Either build better AI (10x better) or ignore AI entirely and differentiate on simplicity.
The "Blue Ocean" approach to competitive analysis:
Red Ocean (copying): Compete in existing space using existing rules Blue Ocean (differentiating): Create new space with new rules
Use competitive analysis to find Blue Ocean opportunities (gaps no one serves).
Pitfall 3: Trusting AI Without Validation
Problem: GPT-4 identifies a "positioning gap." You pivot your entire brand. Later, you discover the gap exists because there's no customer demand.
Solution: AI generates hypotheses. You validate them with customer research, search volume analysis, and small-scale tests.
The Three-Layer Validation Process:
Layer 1: Data Validation
- Check search volume (Google Keyword Planner, Ahrefs)
- Analyze trends (Google Trends: growing vs. declining?)
- Review competitive keywords (anyone ranking for this?)
Layer 2: Customer Validation
- Interview 5-10 customers
- Ask: "Would this positioning resonate with you?"
- Gauge reaction: Excited? Confused? Indifferent?
Layer 3: Market Test
- Run small-scale test (landing page, ad campaign)
- Measure response (CTR, conversion rate)
- Compare to current positioning performance
Only proceed if all three layers validate.
Real example of unvalidated AI insight:
AI identified "blockchain-integrated project management" as positioning gap. Search volume: 10/month. Customer interest: 0/10 interviews cared. Market test: 0.1% CTR (vs. 2.1% baseline).
Verdict: Gap exists because no demand, not because competitors missed opportunity. Ignore it.
Pitfall 4: Ignoring Your Actual Capabilities
Problem: Analysis reveals competitors don't focus on "enterprise security." You reposition around security despite having weak security features.
Solution: Competitive gaps only matter if you can credibly fill them. Match opportunities to your strengths, not just competitor weaknesses.
The Capability-Opportunity Matrix:
Only pursue high-demand opportunities where you have high capability (or can build it quickly).
Real example:
Client wanted to position as "enterprise-grade" after seeing competitors weren't emphasizing enterprise. Problem: They had 8 employees, no enterprise customers, weak security. Pursuing this would have destroyed credibility.
Better approach: Position as "agile alternative to enterprise tools"—playing to their strength (speed, simplicity) instead of pretending to have enterprise capabilities.
Pitfall 5: One-Time Analysis
Problem: You run a comprehensive analysis once per year. By month 3, insights are stale.
Solution: Implement lightweight, continuous monitoring. Weekly check-ins (30 minutes) prevent surprises and keep intelligence fresh.
The Continuous Intelligence Model:
Annual (8 hours): Comprehensive analysis across all dimensions Quarterly (4 hours): Deep dive on one focus area Monthly (1 hour): Review automated monitoring alerts Weekly (30 min): Check key signals (website changes, new content, rankings)
Real example:
Client did annual competitive analysis every January. In June, competitor launched new pricing model. They didn't notice until October (Q4 planning). By then, competitor had gained significant market share with new pricing.
If they had weekly monitoring: Would have spotted pricing change in June, adjusted within 2 weeks, minimized competitive impact.
Implementation Timeline: Your First Week
Day 1: Setup (3 hours)
- Define competitors and analysis scope
- Set up data collection tools (Visualping, Feedly, spreadsheet templates)
- Subscribe to competitor email lists
Detailed Day 1 Tasks:
Hour 1: Define Scope
- List 10 potential competitors
- Narrow to 3-5 using Competitive Overlap Matrix
- Choose 2-3 focus areas based on current decisions
- Write decision statement: "We will decide whether to [ACTION] by [DATE]"
Hour 2: Set Up Tools
- Create Visualping account, add competitor URLs
- Set up Feedly board for competitor blogs
- Configure Zapier workflow (Feedly → Google Sheets)
- Create email templates for data collection
Hour 3: Begin Data Collection
- Subscribe to competitor email lists
- Create Gmail filters and labels
- Set up Google Sheet with tabs (Positioning, Pricing, Content, etc.)
- Screenshot competitor homepages (baseline)
Day 2: Data Collection (4 hours)
- Gather website copy, pricing, content data for 3-5 competitors
- Structure data in analysis spreadsheet
- Export competitor blog titles, email subject lines
Detailed Day 2 Tasks:
Hour 1: Competitor 1 Data Collection (30 min per competitor)
- Homepage: headline, subhead, CTA
- Product pages: key benefits, features
- Pricing page: tiers, pricing model
- About page: positioning statement
- Screenshots of key pages
Hour 2: Competitor 2-3 Data Collection (repeat above)
Hour 3: Content and SEO Data
- Ahrefs: Export top 20 ranking keywords per competitor
- Screaming Frog: Crawl competitor sites, export titles
- Feedly: Export last 20 blog titles per competitor
Hour 4: Structure Data in Spreadsheet
- Populate all tabs (Positioning, Pricing, Content)
- Organize by competitor
- Add notes and initial observations
Day 3: AI Analysis (4 hours)
- Run positioning analysis prompts
- Run pricing analysis prompts
- Run content strategy analysis prompts
- Document raw AI outputs
Detailed Day 3 Tasks:
Hour 1: Positioning Analysis
- Prepare data: Copy positioning data from spreadsheet
- Run GPT-4 prompt: Positioning analysis
- Document output: Value props, categorization, overlaps, gaps
- Initial insight notes
Hour 2: Pricing Analysis
- Prepare data: Copy pricing data from spreadsheet
- Run GPT-4 prompt: Pricing strategy analysis
- Document output: Pricing patterns, anchoring, transparency
- Initial insight notes
Hour 3: Content Analysis
- Prepare data: Copy blog titles from spreadsheet
- Run GPT-4 prompt: Content topic analysis
- Document output: Topic clusters, gaps, audience level
- Initial insight notes
Hour 4: Synthesize Insights
- Review all AI outputs
- Identify 5-7 key insights
- Begin prioritization (impact vs. effort)
Day 4: Validation and Synthesis (3 hours)
- Spot-check AI findings for accuracy
- Cross-reference with quantitative data (search volume, traffic estimates)
- Synthesize into 3-5 actionable insights
Detailed Day 4 Tasks:
Hour 1: Accuracy Validation
- Revisit competitor websites
- Confirm positioning claims
- Check for AI misinterpretations
- Correct any errors in analysis
Hour 2: Quantitative Validation
- Google Trends: Validate positioning gaps
- Ahrefs: Check keyword search volumes
- Customer feedback: Review existing feedback for validation
- Survey data: Check if insights align with customer research
Hour 3: Insight Synthesis
- Choose top 3-5 insights
- Write insight statements (Finding → Implication → Action)
- Score opportunities (impact vs. effort)
- Prioritize using matrix
Day 5: Action Planning (2 hours)
- Create implementation plan for top 3 insights
- Assign owners and timelines
- Present findings to stakeholders
Detailed Day 5 Tasks:
Hour 1: Create Action Plan
- Use Action Plan Template for top 3 insights
- Define: Finding, Implication, Action, Owner, Timeline, Success Metric
- Identify quick wins (< 1 week) vs. longer initiatives
- Draft implementation steps
Hour 2: Stakeholder Presentation
- Create 10-slide presentation:
- Slide 1: Executive summary
- Slide 2: Analysis scope and methodology
- Slide 3-5: Key insights (1 per slide)
- Slide 6-8: Recommended actions (1 per slide)
- Slide 9: Prioritization matrix
- Slide 10: Timeline and next steps
- Present to stakeholders
- Get buy-in for top priorities
Week 2+: Implement and Monitor
- Execute high-priority actions
- Set up continuous monitoring (Visualping, Feedly)
- Schedule monthly review cycles
Week 2 Implementation Plan:
Days 1-2: Quick Wins
- Implement actions requiring < 4 hours
- Example: Update homepage headline, adjust pricing page copy
Days 3-5: Medium Tests
- Launch tests requiring 1-2 days
- Example: Create positioning test landing page, run A/B test
Week 3-4: Longer Initiatives
- Begin actions requiring > 1 week
- Example: Create role-specific content, build lead magnets
Monthly Review Cycle:
Week 1: Review automated monitoring alerts (30 min) Week 2: Check for major competitor changes (30 min) Week 3: Update competitive intelligence log (30 min) Week 4: Monthly synthesis and reporting (1 hour)
Tools and Resources
Data Collection:
- BuiltWith: Technology stack analysis
- Visualping: Website change monitoring
- Hunter.io: Email discovery
- Screaming Frog: Website crawling
- Wayback Machine: Historical website snapshots
SEO and Content Analysis:
- Ahrefs: Keyword rankings, content performance, backlink analysis
- SEMrush: Competitive keyword research, traffic estimates
- BuzzSumo: Content performance analysis
Social and Ads:
- Facebook Ad Library: View competitor Facebook/Instagram ads
- Google Ads Transparency Center: View competitor Google ads
- Brandwatch / Mention: Social listening
AI Analysis:
- ChatGPT (GPT-4): Primary analysis tool
- Claude (Anthropic): Alternative for nuanced analysis
- Perplexity: Research-focused AI with citations
Documentation:
- Google Sheets / Excel: Data structuring and tracking
- Notion: Competitive intelligence database
- Airtable: Filterable competitor profile system
Tool Comparison Matrix:
Recommended starter stack (under $200/month):
- Visualping ($10/mo)
- SEMrush ($119/mo)
- Mention ($29/mo)
- Feedly + Zapier (Free)
- Google Sheets (Free)
- ChatGPT Plus ($20/mo)
- Total: $178/month
Enterprise stack ($500-1,000/month):
- All starter tools
- Ahrefs ($179/mo) — Better than SEMrush for some use cases
- BuzzSumo ($179/mo)
- BuiltWith ($295/mo)
- Brandwatch (custom pricing)
Next Steps in Rapid Experimentation
Competitive intelligence fuels faster testing. Use these insights to inform:
- Product Description Testing: Adapt winning competitor messaging patterns for your product pages
- Email Subject Line Testing: Analyze competitor email strategies, test differentiated approaches
- 48-Hour Testing Workflow: Rapidly test positioning hypotheses identified through competitive analysis
Most companies run competitive analysis once per year as a checkbox exercise. They produce slide decks that age poorly and inform few decisions.
You can build competitive intelligence into your operating rhythm. Weekly monitoring identifies shifts early. AI-powered analysis extracts insights in hours instead of weeks. Continuous iteration keeps your strategy sharp.
Your competitors are analyzing you too. The question isn't whether to do competitive analysis—it's whether you'll do it faster and better than they will.
Ready to build a competitive intelligence system? WE•DO implements AI-powered analysis frameworks for companies that need strategic insights without dedicated research teams. We handle data collection, AI analysis, and insight validation—you focus on executing the strategy. Schedule a consultation to discuss your competitive intelligence needs.
Ready to Transform Your Growth Strategy?
Let's discuss how AI-powered marketing can accelerate your results.