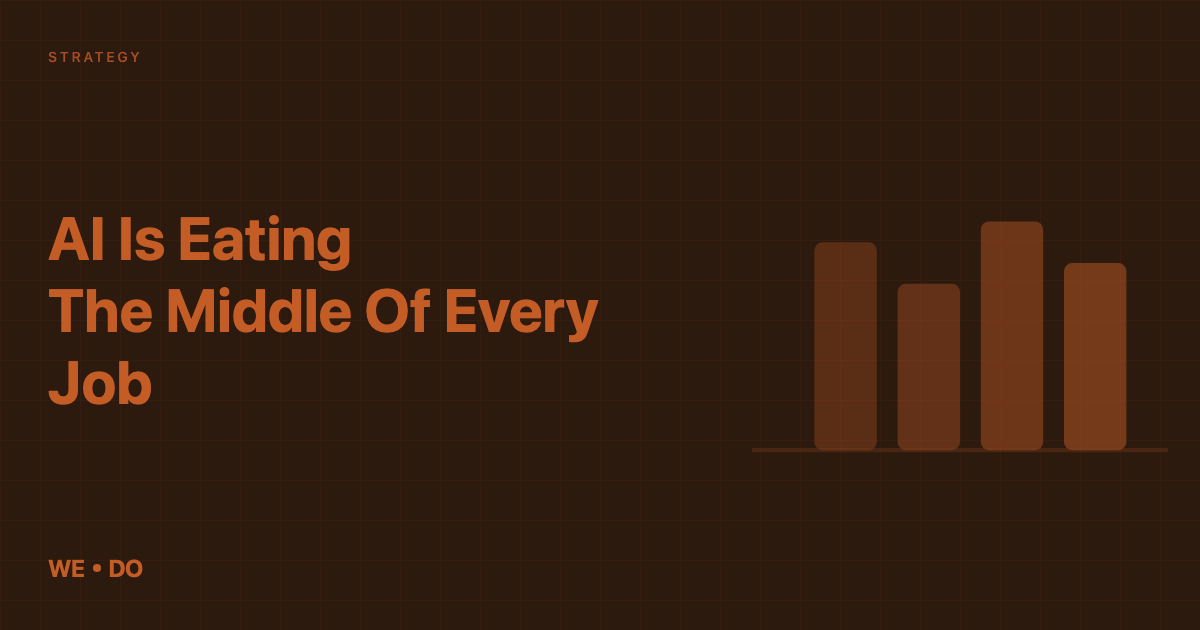
Most agencies spend 4 to 8 hours building a single monthly report. They pull data from GA4, stitch screenshots into a slide deck, add some commentary, and send it off. Then they do it again next month. And again.
We used to do the same thing. Reporting was one of our biggest time sinks. Not because the analysis was hard, but because the assembly was slow. Formatting tables. Matching brand colors. Making sure the logo was the right size. Repeating the same layout for 30+ clients, every single month.
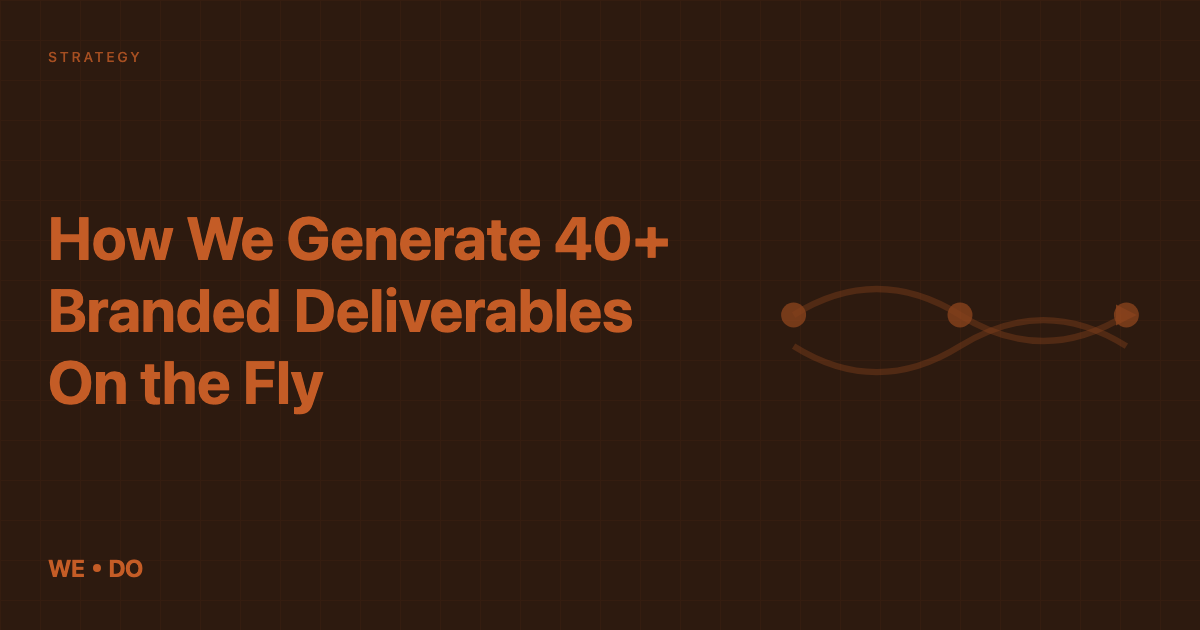
So we built something different. A system that generates branded, data-driven deliverables from scratch in minutes. Not templates you fill in by hand. Not dashboards that require manual screenshots. Fully rendered, self-contained HTML reports that pull live data from every platform we manage.
The Numbers
- 44 deliverable types
- 30+ active clients
- 270+ reports delivered
- ~15 minutes average build time per deliverable
The Problem With Traditional Reporting
Growth marketing generates a lot of data. Google Analytics, Search Console, Google Ads, backlink profiles, keyword rankings, crawl data. The raw numbers are available. The hard part is turning them into something a client can actually use.
Traditional agency reporting usually goes one of two ways:
- Generic dashboards that show numbers without context. Clients get a Looker Studio link and are expected to interpret the data themselves.
- Manual slide decks that take hours to assemble. An analyst pulls screenshots, builds charts, writes commentary. It looks polished, but it does not scale.
Neither approach respects both the client's time and the agency's. Clients want insight, not raw numbers. And the team doing the work should not spend a full day on formatting when they could be doing the actual work that moves the needle.
What We Built
Our deliverable system is a collection of branded HTML templates connected to live data sources. When we need to produce a report, proposal, audit, or plan, we specify the client and the deliverable type. The system pulls the relevant data, renders it with our brand standards, and outputs a self-contained HTML file that works in any browser.
Every deliverable shares the same foundation:
- Consistent brand system. One design language across all 44 deliverable types. Same typography, same color palette, same spacing, same data visualization standards.
- Live data integration. Reports pull directly from GA4, Google Search Console, Google Ads, and third-party SEO platforms. No copy-pasting. No stale screenshots.
- Self-contained HTML. Each deliverable is a single file. No external dependencies beyond fonts and icons. Open it in a browser, send it as a link, export to PDF.
- Secure delivery. Reports are deployed to a password-protected portal. Clients get a direct link to their deliverables. No shared drives or email attachments.
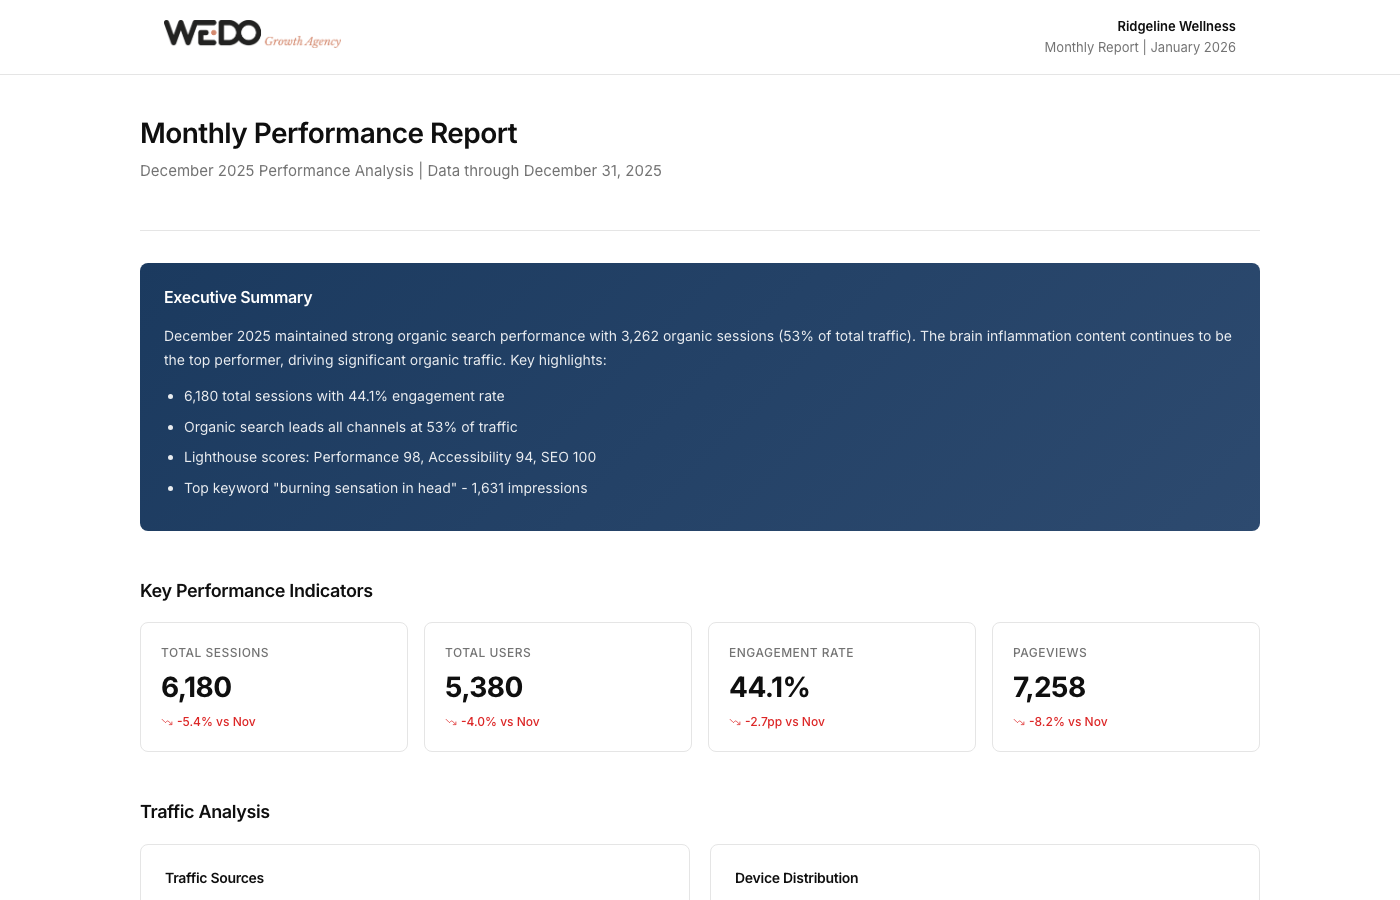
Monthly Performance Reports
The most common deliverable we produce. Every client gets one each month with KPIs, traffic analysis, channel breakdowns, top content, and strategic recommendations. All data pulled directly from GA4 and Search Console.
44 Deliverable Types, One Design System
We do not just build reports. The system covers every document we deliver to clients, organized by engagement phase. Foundation audits, build-phase optimizations, ongoing reporting, and specialized analyses all share the same visual DNA.
Foundation phase deliverables include technical SEO audits, competitor analyses, keyword research, content audits, and analytics audits. These set the baseline for every engagement.
Build phase deliverables cover on-page optimization reports, internal linking analyses, content calendars, campaign builds, and CRO audits. This is where strategy becomes execution.
Ongoing reporting includes monthly reports, weekly reports, 30-day interactive dashboards, quarterly reviews, and campaign performance summaries. These keep clients informed and aligned.
Specialized deliverables handle everything else: topic cluster plans, search term analyses, strike zone reports, page speed audits, conversion funnel analyses, and more.
Plus proposals, voice and tone guides, and A/B test documentation. Every type follows the same design principles and data integration approach.
A Closer Look
Each deliverable type serves a different purpose, but the experience is always consistent. Clean layout, real data, actionable insight.
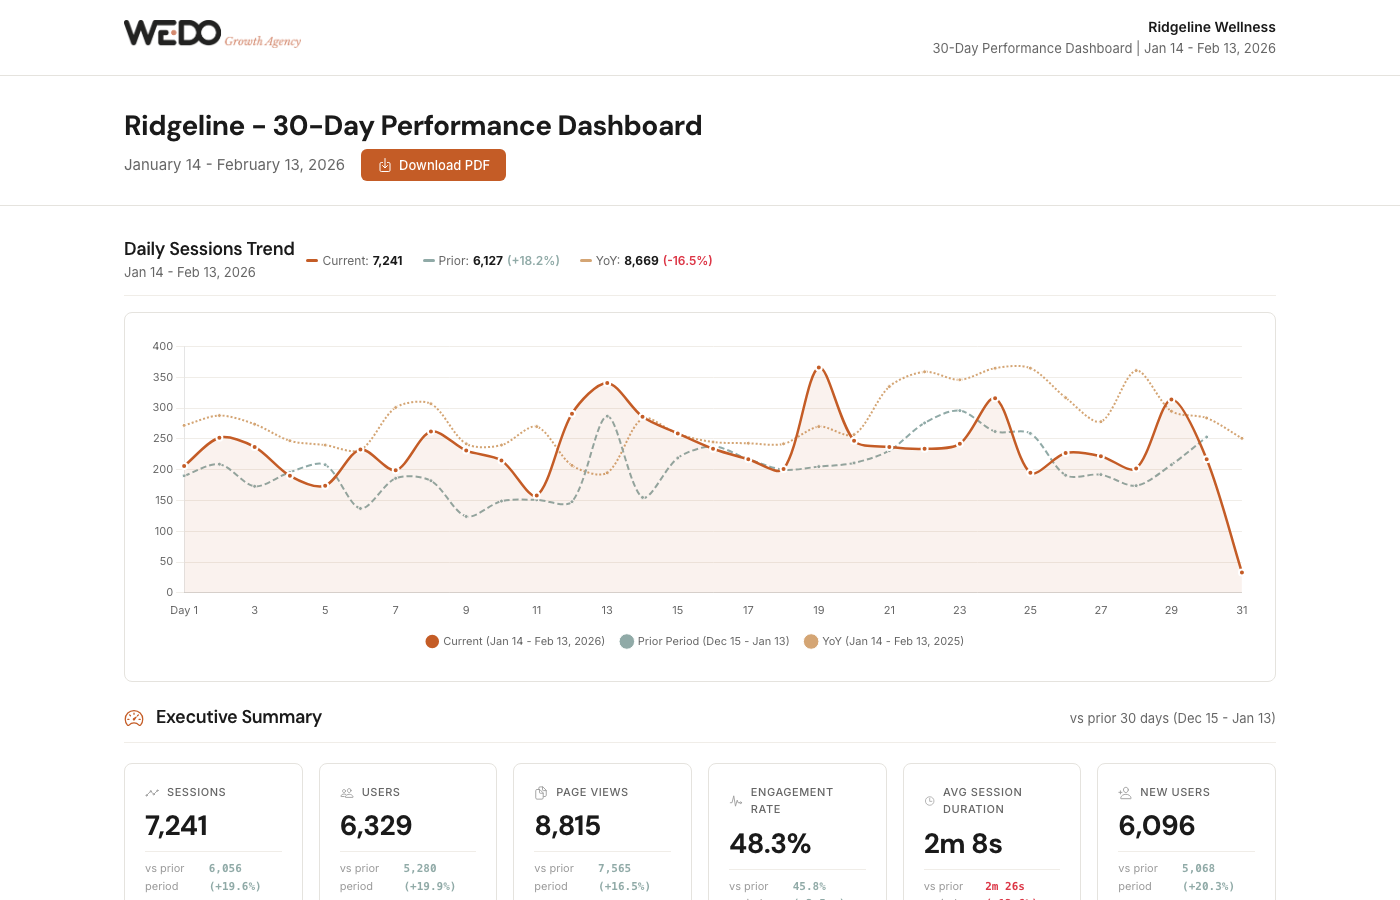
30-Day Performance Dashboard
Interactive daily trends with period-over-period and year-over-year comparisons, conversion funnels, and traffic source breakdowns.
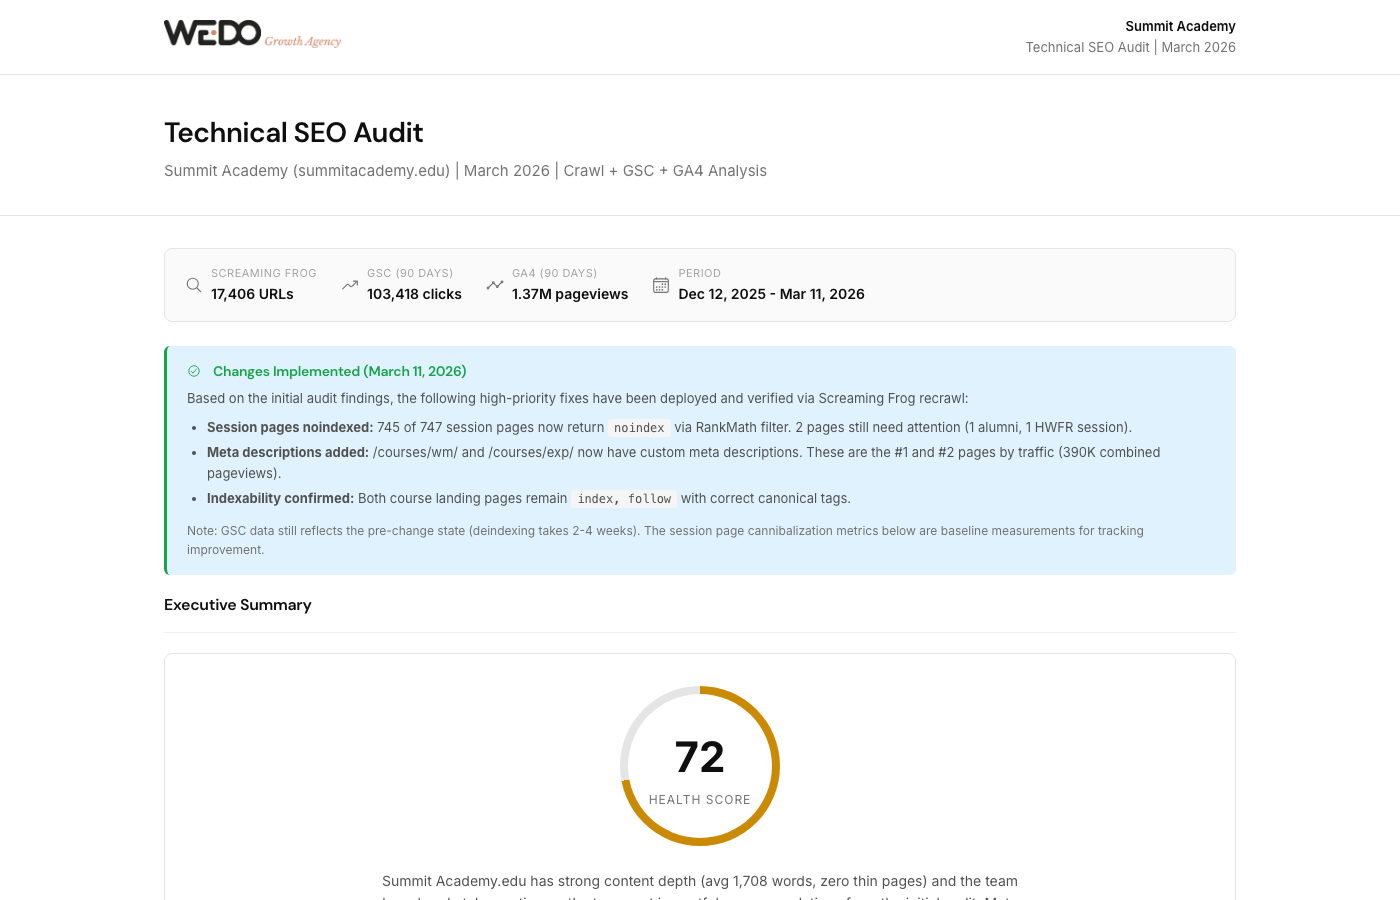
Technical SEO Audit
Crawl analysis with health scoring, priority issue identification, and implementation verification tracking.
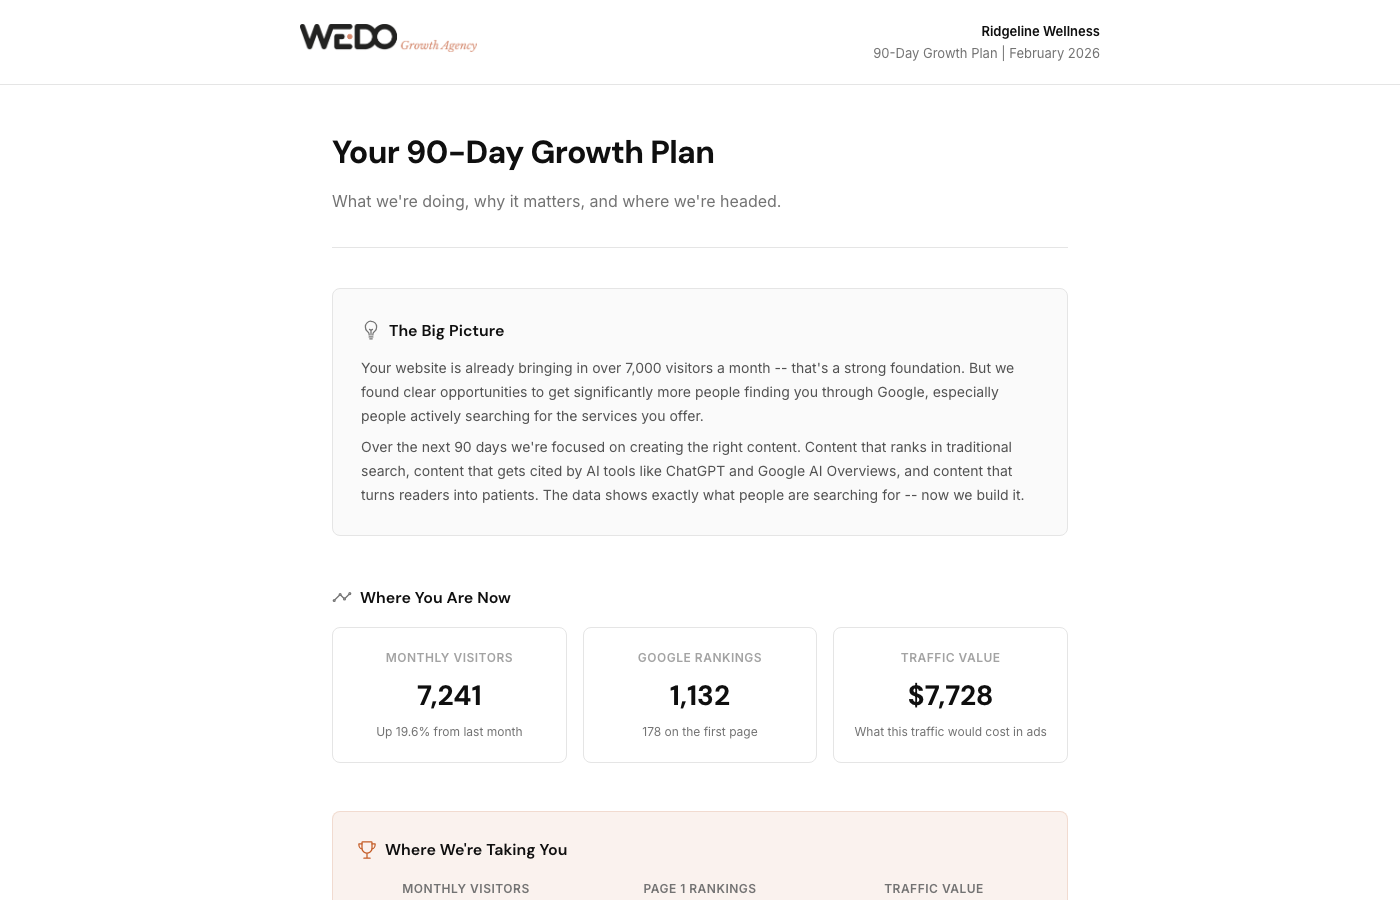
90-Day Growth Plan
Current performance baseline, growth targets, and phased initiative breakdown. This is the strategic roadmap that guides each engagement.
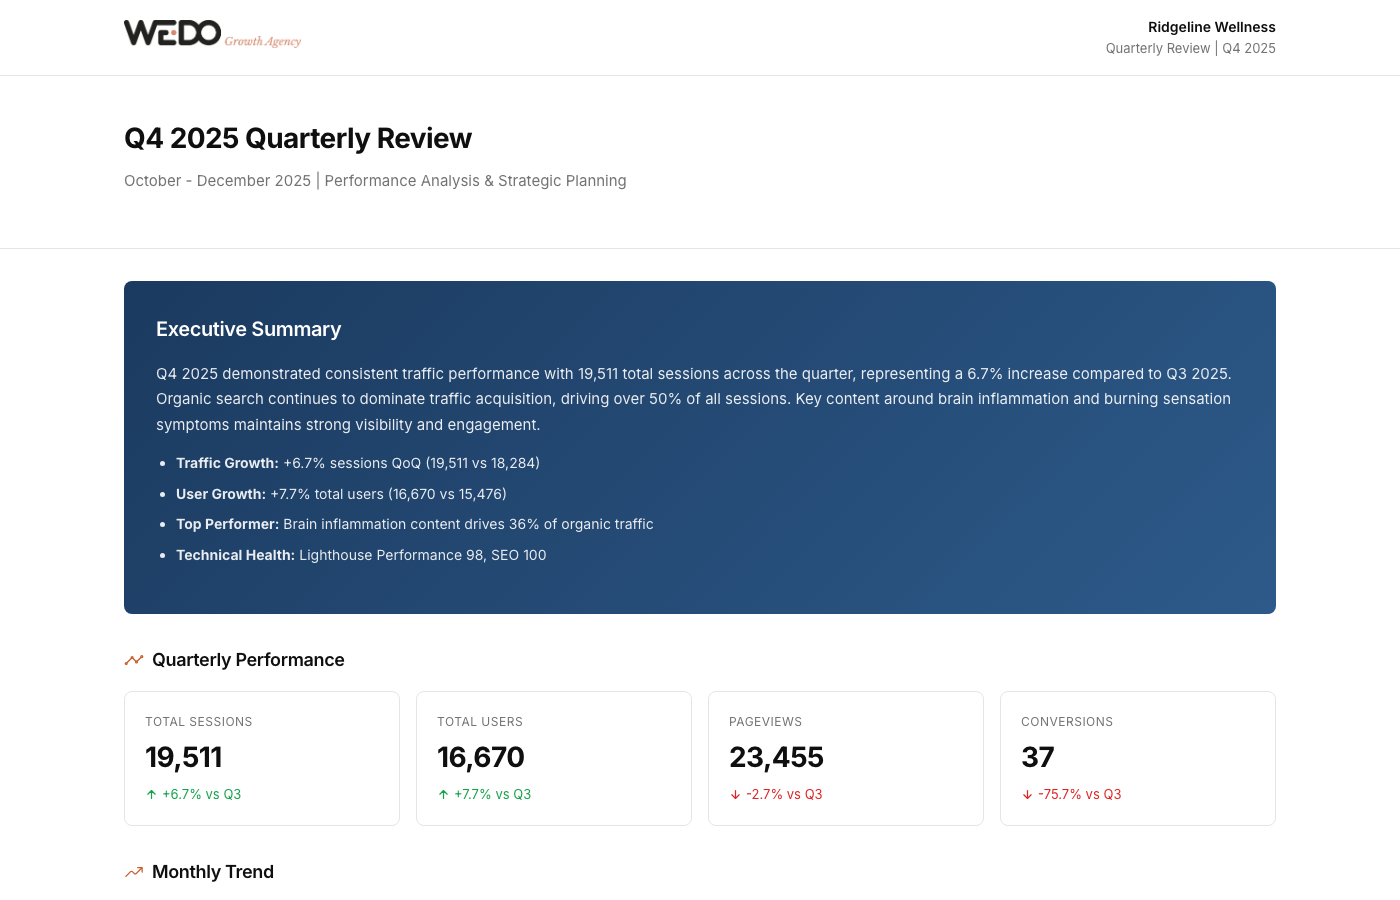
Quarterly Review
Quarter-over-quarter and year-over-year analysis with strategic executive summary and recommendations for the next period.
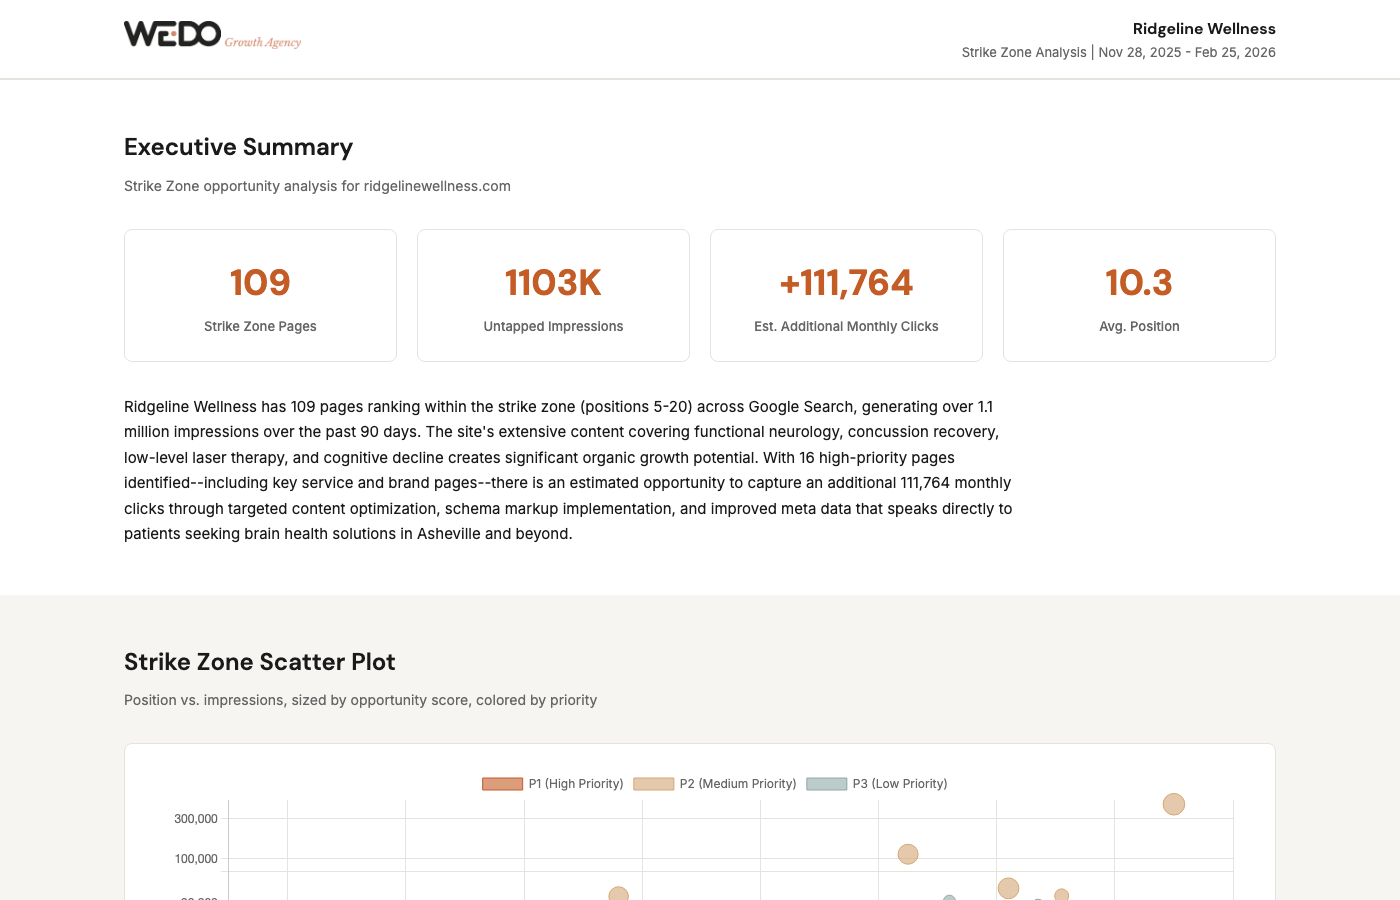
Strike Zone Analysis
Pages ranking positions 5 through 20 with untapped impression volume and estimated click opportunity. These are the pages closest to breaking through to page one.
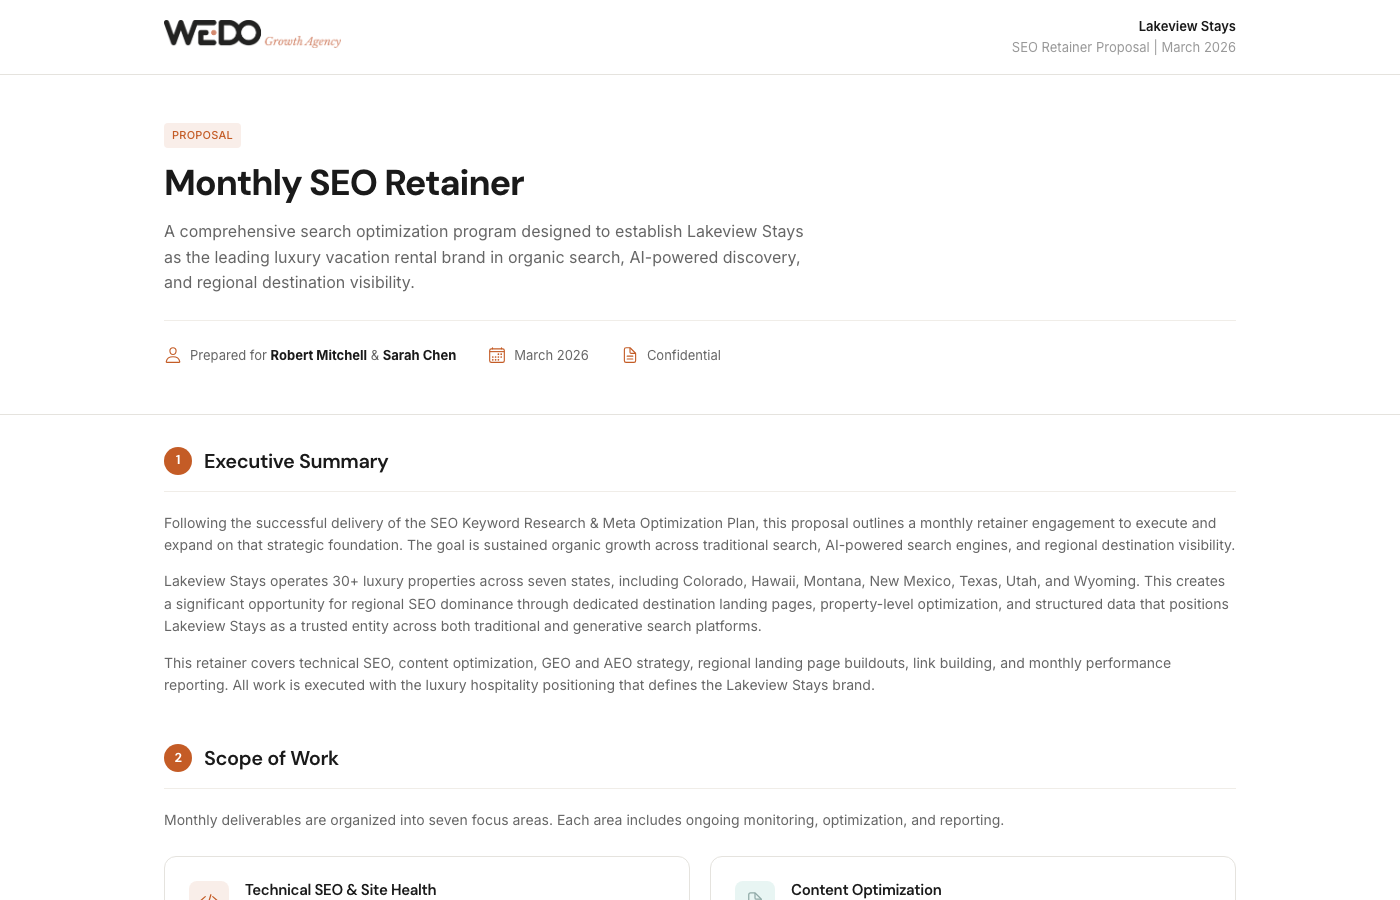
Service Proposal
Scope of work, strategic rationale, and engagement terms presented in a polished, client-ready format.
How It Works
The workflow behind each deliverable follows the same pattern, regardless of type.
1. Identify the Deliverable
Specify the client, deliverable type, and reporting period. The system looks up the client's data source IDs (GA4 property, Search Console site, Ads account) from a central registry.
2. Pull Live Data
Each deliverable type has a defined set of data sources. A monthly report pulls GA4 traffic and Search Console rankings. A technical audit adds crawl data. A PPC report pulls Google Ads campaigns. The data matrix is defined per template.
3. Render With Brand Standards
Data is rendered into the appropriate template with our brand system applied. Colors, typography, chart styling, spacing, and layout are all controlled by a centralized configuration. One brand config controls every deliverable.
4. Add Strategic Commentary
Numbers without context are just noise. Every deliverable includes an executive summary, trend analysis, and actionable recommendations specific to the client's situation and goals.
5. Deploy and Deliver
The finished deliverable deploys to a password-protected client portal. Each client has their own URL namespace. Reports are versioned and accessible anytime.
The Brand System
Consistency across 270+ deliverables does not happen by accident. Every visual decision is encoded in a single brand configuration file that controls the entire system.
One source of truth. Color palette, typography scale, spacing system, chart colors, severity scales, logo placement, and layout rules all live in one configuration. Change it once, it applies everywhere.
The brand system defines:
- Color palette. A warm, professional palette anchored by burnt orange as the primary accent, sage green for secondary elements, and tan for highlights. Status colors follow the same family for consistency across data visualizations.
- Typography hierarchy. DM Sans for headings and display text. Inter for body content and data labels. A defined scale from H1 through caption text ensures visual consistency at every level.
- Data visualization standards. Charts with brand colors applied consistently. Line charts, bar charts, donut charts, scatter plots, and gauge visualizations all use the same color mapping. Green for positive trends, red for negative, orange for warnings.
- Component library. KPI cards, executive summary callouts, data tables, metric comparisons, severity badges, and section headers are reusable components that appear across all deliverable types.
Beyond Reports
The system is not limited to performance reporting. The same brand standards and data integration approach extends to strategic documents, brand guidelines, and experimentation frameworks.
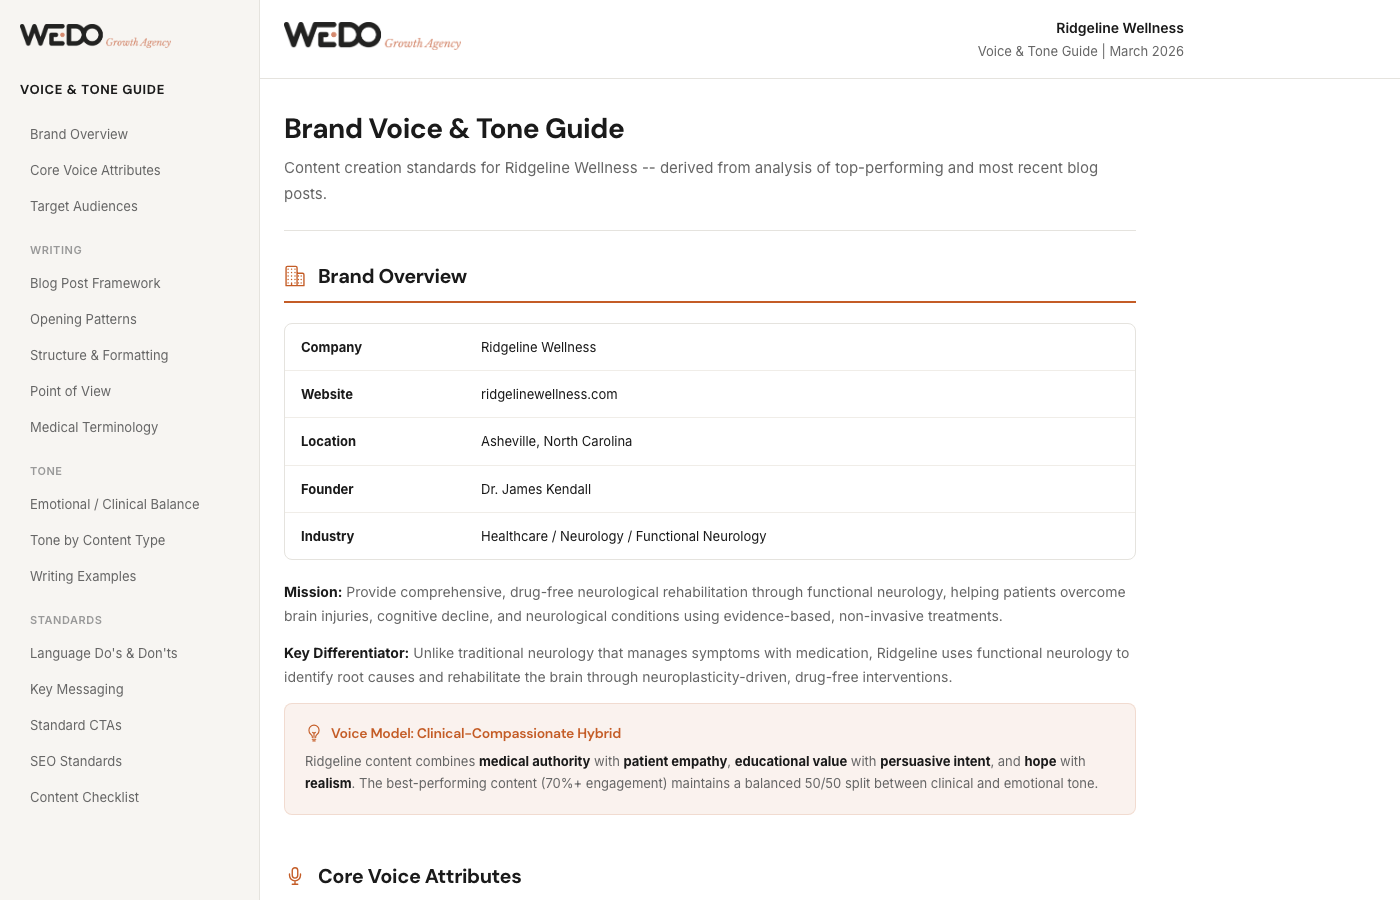
Voice and Tone Guides
Brand voice frameworks built from analysis of top-performing content, with real examples, dos and don'ts, and platform-specific variations.
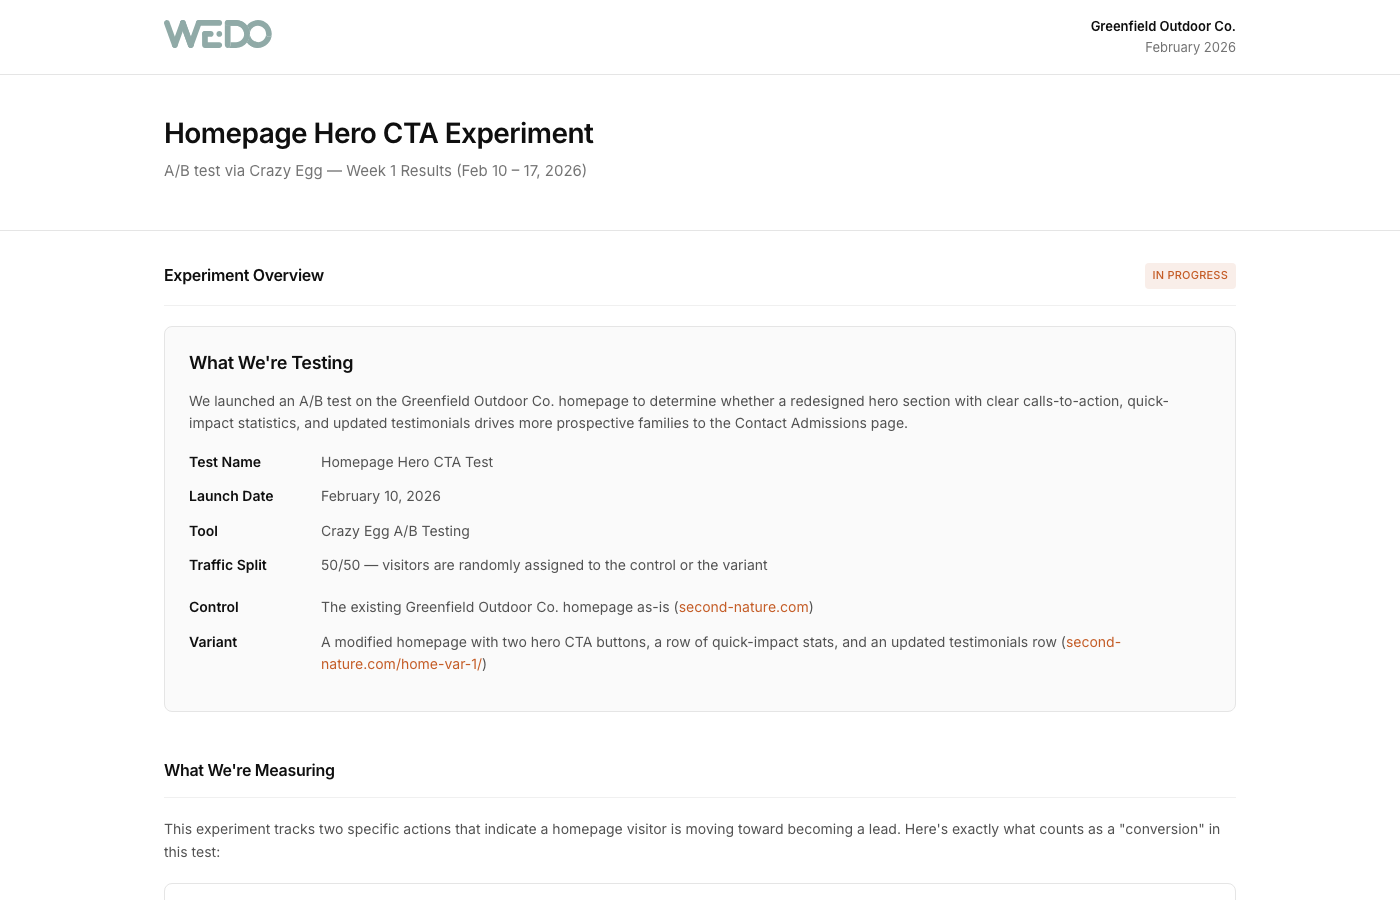
CRO Experiment Reports
A/B test documentation with hypothesis, implementation details, traffic splits, and performance analysis with statistical context.
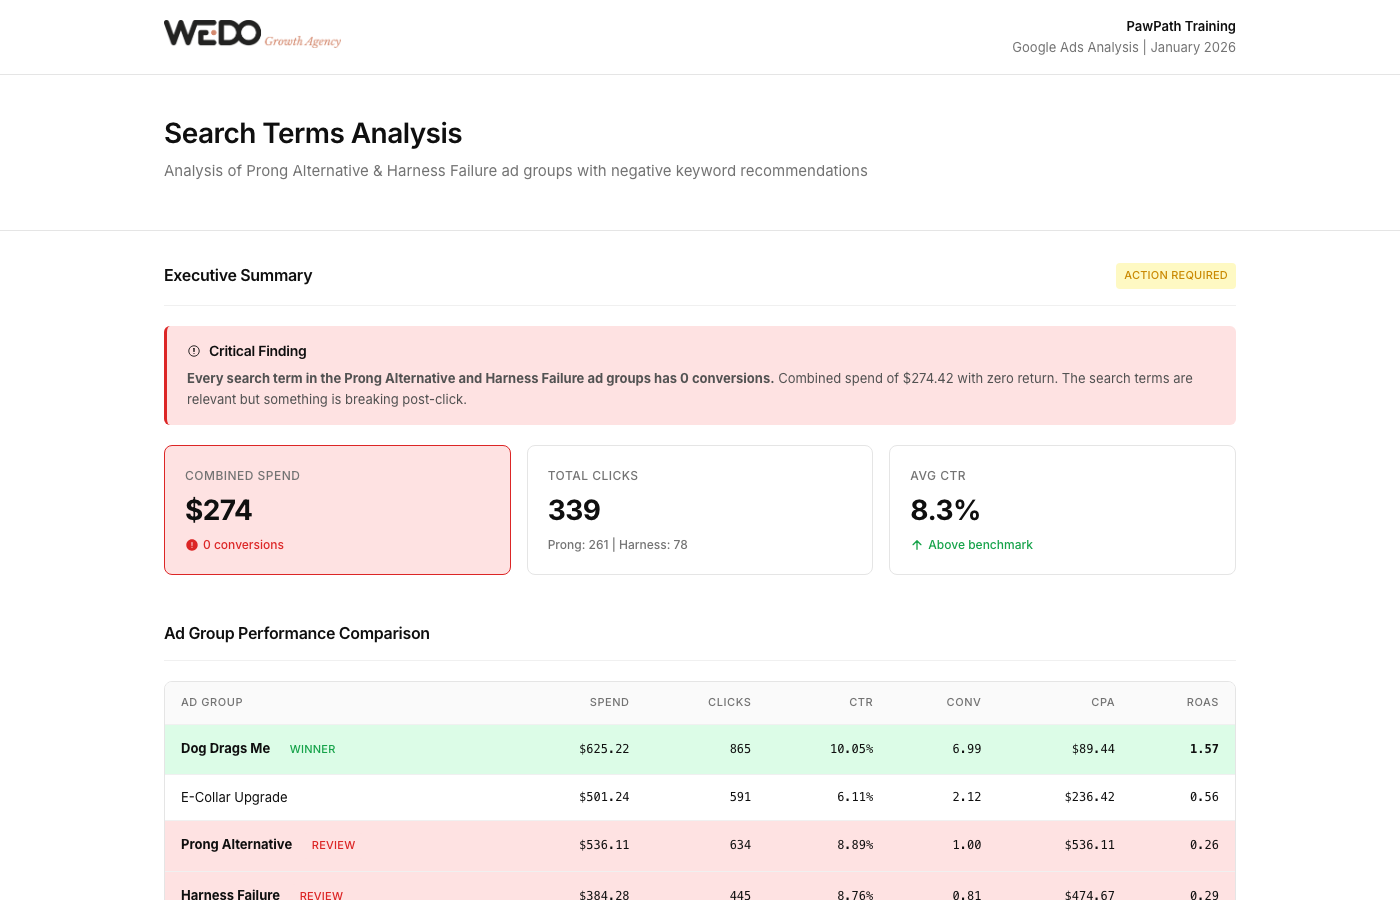
Search Terms Analysis
Google Ads search query mining that identifies keyword expansion opportunities and negative keyword recommendations to reduce wasted spend.
Why This Matters for Clients
Speed and consistency are nice for internal operations. But the real benefit is what it means for the people we work with.
More time on strategy, less on assembly. When reporting takes 15 minutes instead of 4 hours, the team spends more time on the work that actually drives results. Better keyword strategy. Smarter content plans. More thoughtful technical recommendations.
Real data, real time. Every number in every report is pulled from the source at generation time. No month-old screenshots. No manually transcribed figures. When a client opens their 30-day dashboard, the data is as current as the APIs allow.
Consistent quality at scale. Client number 1 and client number 30 get the same level of polish. The same brand standards, the same depth of analysis, the same attention to detail.
A complete record. Every deliverable is versioned and accessible through the client portal. Want to compare this quarter's SEO audit to the one from six months ago? It is one click away. The archive becomes a performance timeline that shows the trajectory of the engagement.
What Is Next
We are continuing to expand the system. Interactive elements like filterable tables and expandable sections are being added to audit reports. New deliverable types for AI search optimization and content performance tracking are in development. And we are building a client-facing index page that gives each client a single entry point to all of their deliverables, organized chronologically.
The goal has not changed since we started building this: give clients better insight with less friction, and give our team more time to do the work that matters.
Want to see what this level of reporting looks like for your business? Start a conversation and we will show you.