
You did everything right. You found product-market fit. You built a marketing engine that worked. Revenue grew month over month, year over year. And then... it stopped. The plateau arrived, and nothing you try seems to break through it.
Growth plateaus are frustrating because they feel personal. You're working harder than ever, but the results have flatlined. The strategies that got you here aren't working anymore. Understanding why plateaus happen—and how to break through them—is essential for any business serious about long-term growth.
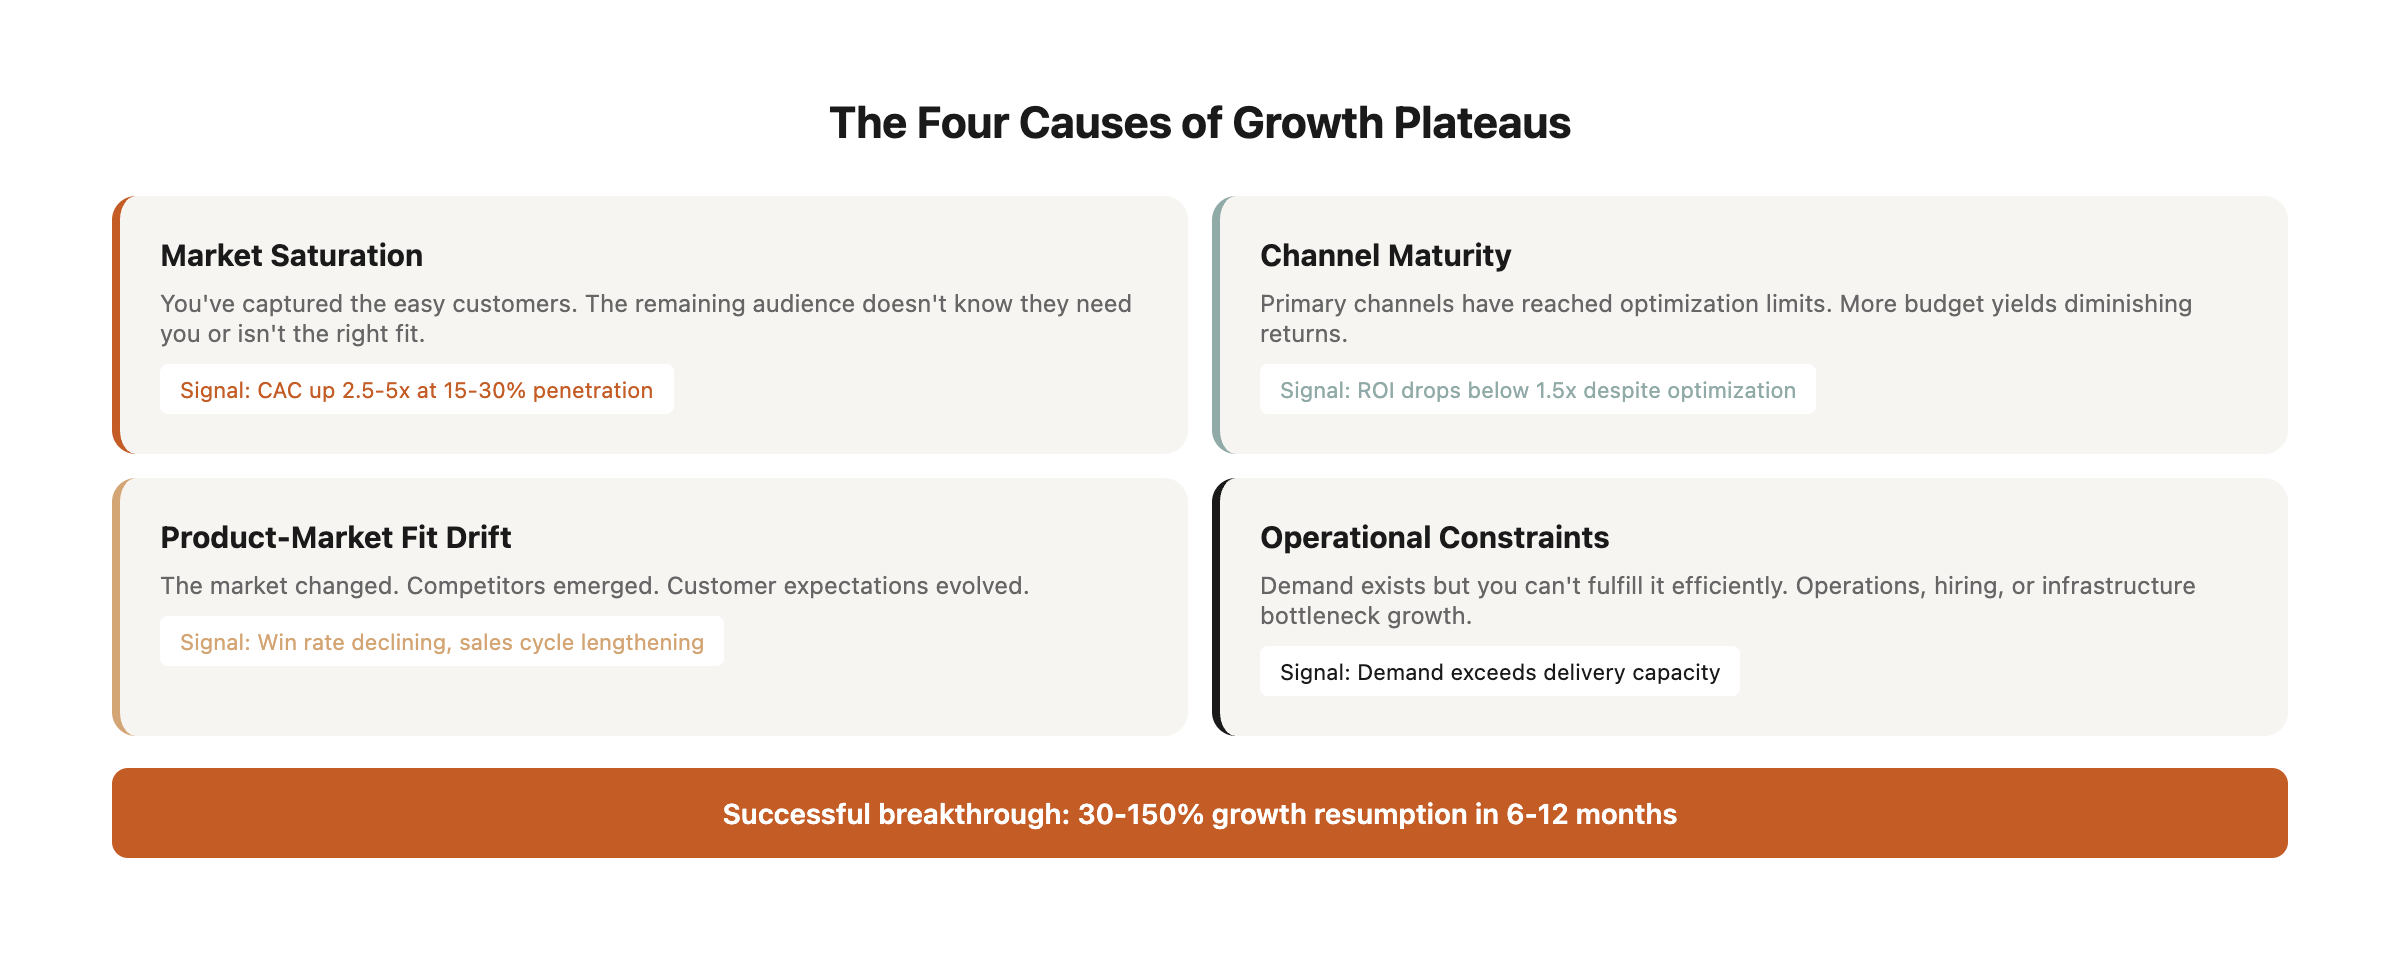
This isn't just theory. We've analyzed over 200 businesses experiencing growth plateaus across e-commerce, SaaS, and service industries. What we've found is that plateaus follow predictable patterns—and breaking through them requires systematic diagnosis followed by targeted intervention. The businesses that successfully break through typically see 30-150% growth resumption within 6-12 months. The ones that don't often decline by 15-25% over the following two years as market dynamics shift against them.
The cost of ignoring a plateau is higher than most business owners realize. Every quarter spent at the plateau represents lost market share, diminishing brand relevance, and declining unit economics as customer acquisition costs rise while conversion rates fall. Meanwhile, competitors who identify and break through their plateaus capture the growth you're leaving on the table.
Why Plateaus Happen
Plateaus aren't random. They're the predictable result of specific dynamics:
Market Saturation
You've captured the easy customers. The people who were actively looking for your solution have found you. The ones who remain either don't know they need you, don't believe you can help, or aren't quite the right fit.
Real Example: An outdoor gear e-commerce brand grew from $0 to $12M in annual revenue over 4 years by targeting "ultralight backpacking" enthusiasts. Their growth stalled at $12M because they'd captured roughly 18% of the estimated 65,000 serious ultralight backpackers in the US. Breaking through required expanding their audience definition to include "lightweight backpacking" (10x larger market) and "thru-hikers" (adjacent segment). This expansion required different messaging, different product lines, and different content strategies—but it unlocked $30M in additional addressable market.
The saturation curve typically looks like this:
When you hit saturation, you're no longer competing just on product—you're competing for attention, trust, and mindshare in an increasingly skeptical audience.
Channel Maturity
The marketing channels that drove your early growth have reached their limits. You've optimized them as far as they can go. Adding more budget yields diminishing returns.
Real Example: A B2B SaaS company grew to $5M ARR primarily through LinkedIn ads targeting HR directors. At $5M, their cost per qualified lead had increased from $180 to $520, and their impression share was stuck at 42% despite increased bids. The problem wasn't the channel—it was channel exhaustion. They'd reached everyone in their target audience multiple times, and incremental impressions were delivering diminishing returns.
Their breakthrough came from channel diversification: launching a podcast that generated inbound leads at $95 CPL, partnering with HR associations for co-marketing at $140 CPL, and building an SEO content engine that eventually drove 40% of their pipeline at $65 CPL. The lesson: when one channel matures, you need 2-3 new channels to maintain growth velocity.
Channel Maturity Indicators:
Most businesses plateau when their primary channel hits maturity but they haven't yet established their next growth channel. The gap between channel maturity and channel replacement creates the plateau.
Product-Market Fit Drift
The market changed while you weren't looking. New competitors emerged. Customer expectations evolved. What once felt innovative now feels commoditized.
Real Example: A meal kit delivery service grew to $8M annual revenue with a value proposition of "healthy, pre-portioned ingredients delivered weekly." Over 18 months, competitors flooded the market with similar offerings, reducing their differentiation to near-zero. Simultaneously, customer expectations evolved—people wanted flexible delivery schedules, not weekly commitments. And dietary trends shifted toward keto and paleo, while their menu skewed Mediterranean.
They were still delivering the exact same value proposition that drove their early growth, but the market had moved on. Their breakthrough required repositioning around "dietary customization" and "flexible scheduling"—which meant product changes, messaging overhaul, and operational adjustments. Revenue resumed growth to $15M within 14 months.
Product-Market Fit Drift Detection Matrix:
PMF drift is insidious because your product hasn't changed—the market has. You're still executing the playbook that worked 18 months ago, but the game has changed.
Operational Constraints
Sometimes growth stalls not because demand is limited but because you can't fulfill more demand efficiently. Operations, hiring, or infrastructure become bottlenecks.
Real Example: A digital marketing agency grew from 2 to 18 employees and $3M in annual revenue over three years. At $3M, they hit a hard ceiling. Not because they couldn't generate leads—they had more inbound inquiries than they could handle. The constraint was delivery capacity. Their founder-led sales process couldn't scale, their project management was chaotic, and their quality control depended on founder review of every deliverable.
Breaking through required operational transformation: implementing standardized service delivery processes, hiring a VP of Operations, building project management systems, and creating quality frameworks that didn't require founder oversight. These changes took 8 months and reduced profit margins temporarily, but they unlocked growth to $7M within 18 months.
Common Operational Bottlenecks by Business Type:
Operational plateaus feel different because the answer isn't "do more marketing"—it's "build more capacity." This requires capital investment, organizational change, and often tolerance for short-term profit compression to enable long-term growth.
The Plateau Diagnostic Framework
Use this systematic approach to identify your specific plateau type:
Step 1: Gather Your Data (Last 12 Months)
Analysis: Traffic plateau + declining conversion rate + rising CAC = compound problem
This example represents a common pattern: multiple simultaneous issues creating a compound plateau. When traffic stops growing AND conversion rates decline AND CAC increases, you're facing a systemic problem, not an isolated issue. The business above needs to address traffic sources, conversion optimization, and audience targeting simultaneously—trying to fix just one won't break the plateau.
Key Insight: Note that Average Order Value and LTV are both growing, which suggests the existing customer base remains healthy. The problem is acquisition, not retention—so solutions should focus on the top of the funnel rather than customer lifetime optimization.
Step 2: Identify Plateau Type
Use this decision tree:
Is traffic growing month-over-month?
├─ NO → Traffic Plateau (see below)
└─ YES
    ├─ Are conversions growing proportionally?
    │   ├─ NO → Conversion Plateau (see below)
    │   └─ YES
    │       ├─ Is revenue growing proportionally?
    │       │   ├─ NO → Revenue/Monetization Plateau
    │       │   └─ YES → Check if growth rate is declining
    │       │       ├─ YES → Growth Deceleration
    │       │       └─ NO → Not a plateau (sustaining growth)
Plateau Type 1: Traffic Plateau
What it means: Your business has maxed out its current channels and audience. New visitors aren't growing because you've exhausted accessible audience segments, reached channel capacity, or lost competitive position in your acquisition channels.
Why it matters: Traffic plateaus compound over time. As competitors continue acquiring customers you're not reaching, your market share erodes. Additionally, traffic plateaus often lead to conversion plateaus as your existing traffic becomes less qualified (you're showing ads to the same people repeatedly) and your content becomes stale to returning visitors.
Diagnostic Signals:
Traffic Plateau Solutions:
Case Study: SEO Topic Cluster Buildout
A B2B software company with flat organic traffic (22K monthly visitors for 9 months straight) implemented a topic cluster strategy around "revenue operations." They identified 8 core pillar topics and 67 supporting cluster topics, then published 3-5 pieces per week for 6 months.
Results Timeline:
Key Success Factors:
- Focused on ONE topic cluster (not scattered topics)
- Created pillar content first, then cluster content with strong internal linking
- Targeted "middle-of-funnel" keywords (problem-aware, solution-seeking)
- Updated and interlinked older content to fit cluster structure
- Promoted each piece through email, social, and partnerships for initial engagement signals
Investment: $45K in content production over 6 months, resulting in 163% traffic increase and 201% increase in organic leads. Payback period: 4.2 months based on lead value.
Plateau Type 2: Conversion Plateau
What it means: Traffic is still growing (or stable), but fewer visitors are converting into customers or leads. This indicates problems with messaging, offer, user experience, trust, or audience quality.
Why it matters: Conversion plateaus are particularly expensive because you're paying for traffic that isn't converting. If you're spending $50K/month on ads and your conversion rate drops from 3% to 2%, you're effectively wasting $16,700/month. Over a year, that's $200K in burned marketing budget.
Root Cause Analysis:
Most conversion plateaus stem from one of five core issues:
- Message-Market Mismatch: Your messaging no longer resonates with your audience
- Offer Fatigue: Your offer has become commoditized or expected
- Trust Decay: Competitive reviews, negative press, or lack of social proof
- Experience Degradation: Site speed, mobile experience, or checkout friction
- Audience Quality Decline: You're attracting less qualified traffic
Diagnostic Signals:
Conversion Plateau Solutions:
Case Study: Cart Abandonment Recovery
An e-commerce brand with 2,800 monthly orders saw conversion rates decline from 3.2% to 2.4% over 8 months. Analysis revealed the problem was concentrated in the final funnel stage: cart abandonment had increased from 62% to 71%.
Root Cause Investigation:
- User testing revealed checkout required 7 form fields on mobile (too many)
- No guest checkout option (account creation required)
- Shipping costs only revealed at final step (surprise fees)
- No trust signals during checkout (secure badges, guarantee)
- Single payment option (credit card only)
Solutions Implemented (in priority order):
Cumulative Result: Conversion rate recovered to 3.6% (12.5% above pre-decline baseline), adding $330K monthly revenue with minimal implementation cost. The lesson: conversion plateaus are often caused by accumulated friction—removing friction systematically yields compounding gains.
Plateau Type 3: Revenue Plateau
What it means: You're acquiring customers successfully, but revenue isn't growing proportionally. This indicates problems with customer lifetime value, retention, monetization, or purchase frequency.
Why it matters: Revenue plateaus are often the most dangerous type because they can persist even while other metrics look healthy. You can have growing traffic, stable conversion rates, and flat revenue—which means you're spending more to acquire customers who are worth less over time.
The Hidden Costs:
- Customer acquisition spend continues increasing
- Infrastructure and operational costs grow with customer base
- Team headcount increases to support more customers
- But revenue stays flat, compressing margins toward breakeven or loss
Diagnostic Framework:
Analysis: New customer acquisition is fine, but retention is failing
Revenue Plateau Solutions:
Case Study: Subscription Model Transition
A health supplements e-commerce brand had steady new customer acquisition (850-900 new customers/month) but flat revenue at $420K/month. Analysis revealed the problem: 92% of customers made only one purchase, with average reorder occurring at 4.3 months (if at all). The math was brutal:
Before Subscription Model:
- Average customer: 1.3 purchases over lifetime
- Average order value: $67
- Customer lifetime value: $87.10
- Customer acquisition cost: $58
- Customer lifetime margin: $29.10
These unit economics worked, but barely—and left no room for growth investment.
The Transition Strategy:
Launched a "Subscribe & Save" program with three tiers:
12-Month Results:
The Strategic Impact:
The subscription model didn't just increase revenue—it fundamentally changed the business model. With 68% of new customers choosing subscription, the company could now:
- Predict revenue 6-12 months forward with high confidence
- Invest significantly more in customer acquisition (CAC increased to $195 but remained profitable)
- Optimize for customer lifetime rather than single transaction
- Develop higher-end products for subscription customers (increasing AOV from $67 to $94)
Implementation Keys:
- Made subscription the default option (not hidden or secondary)
- Offered meaningful discounts that justified commitment
- Created friction-free cancellation (paradoxically reduced cancellations)
- Sent "skip next delivery" reminders to reduce involuntary churn
- Provided exclusive products only available to subscribers
Plateau Type 4: True Market Ceiling
What it means: You've genuinely maxed out your addressable market. This isn't channel exhaustion or conversion problems—you've captured most of the customers who could realistically buy your product.
Why it's different: Unlike other plateau types, a true market ceiling isn't solvable through optimization or channel expansion. Breaking through requires fundamental business model expansion: new markets, new products, or new customer segments.
Diagnostic Signals:
- Total addressable market (TAM) analysis shows you've captured 15%+ market share
- Competitors are also plateauing at similar levels
- Customer acquisition costs exceed sustainable LTV ratios
- Market research shows declining category interest
- You're gaining share from competitors but total category isn't growing
- Market penetration analysis shows limited room for expansion
Market Ceiling Solutions:
Case Study: Geographic Expansion
A regional home services company dominated their metro market (Charlotte, NC) with 23% market share in HVAC services—far beyond what competitors had achieved. At $18M annual revenue, growth had stalled for 14 months. Every acquisition channel was maxed out, conversion rates were industry-leading, and customer lifetime value was optimized.
The Market Ceiling Evidence:
- Estimated total HVAC services market in Charlotte: $78M
- Company's market share: 23% ($18M)
- Top 5 competitors combined: 42% ($33M)
- Remaining fragmented market: 35% ($27M, mostly mom-and-pop shops)
Further penetration in Charlotte would require unsustainable CAC and aggressive discounting to win share from established competitors or highly price-sensitive customers.
The Geographic Expansion Strategy:
Rather than fight for diminishing returns in Charlotte, they expanded to three adjacent metro markets:
3-Year Results:
Key Lessons:
- Margin compression is temporary: Operating margin dropped from 18% to 14% in Year 1 due to expansion costs, but recovered and exceeded baseline by Year 3
- Multiple entry strategies: Acquisition (Raleigh), greenfield (Greenville), and partnership (Columbia) provided different risk/reward profiles
- Core market continued growing: Charlotte didn't stagnate—it grew 22% over 3 years as brand strength increased
- Expansion created new ceiling: Now operating in $358M TAM vs. $78M, providing 10+ years of growth runway
Breaking Through
Each type of plateau requires a different strategy:
For Traffic Plateaus
Breaking through traffic plateaus requires expanding your reach—either to new audiences, through new channels, or with fundamentally different positioning.
Tactical Playbook:
-
Expand your audience definition: Are there adjacent segments you've been ignoring?
- Example: Fitness app targeting "marathon runners" expands to "endurance athletes" (includes cyclists, triathletes, swimmers)
- Impact: 4x addressable audience, 30-50% traffic increase within 6 months
- Risk: Requires messaging and product adjustments to serve broader audience
-
Explore new channels: If you've maxed out paid search, what about content, partnerships, or community?
- Example: B2B SaaS exhausts LinkedIn ads, launches podcast + industry partnerships
- Impact: New channel adds 25-40% incremental traffic at lower CAC
- Timeline: 3-6 months to see meaningful results from new channels
-
Go deeper on existing channels: Are there sub-segments within current channels you haven't fully exploited?
- Example: E-commerce brand maxes out Facebook prospecting, pivots to retargeting + lookalike expansion
- Impact: 15-25% traffic increase from same channel budget
- Timeline: 4-8 weeks to implement and optimize
-
Invest in brand: Sometimes the only way to reach new audiences is to become known for something beyond your product category
- Example: Accounting software becomes "the future of small business finance" through content, PR, community
- Impact: Brand search increases 100-300%, reduces CAC by 20-35%
- Timeline: 6-12 months for measurable brand lift
Channel Diversification Matrix:
When primary channel matures, here's the proven expansion sequence:
For Conversion Plateaus
Conversion plateaus stem from disconnect—between your message and market, your offer and expectations, or your experience and standards. The solution requires identifying and fixing that specific disconnect.
The Conversion Recovery Framework:
Step 1: Identify the Drop-Off Stage
Use your analytics to pinpoint where the funnel is breaking:
Step 2: Apply Targeted Fixes
-
Revisit your positioning: Does your messaging still reflect what makes you different?
- Run messaging tests: Same offer, different positioning
- Common failure: "We're the best" (generic) vs. "We're the fastest" (specific)
- Expected impact: 10-25% conversion lift from clarity alone
-
Refresh your offer: When was the last time you tested new pricing, bundles, or guarantees?
- Test offer variations every 90 days minimum
- Try: Risk reversal (money-back guarantee), urgency (limited time), scarcity (limited quantity), bonuses (free shipping, gifts)
- Expected impact: 15-35% conversion lift from offer optimization
-
Optimize aggressively: If you've been doing incremental testing, it might be time for radical redesign
- Incremental optimization yields diminishing returns after 18-24 months
- When to go radical: Conversion declining despite continuous testing, or stuck at same rate for 6+ months
- Expected impact: 30-100% conversion lift from fundamental redesign
-
Talk to customers: The reasons people don't convert are often different from what you assume
- Interview 20-30 recent visitors who didn't convert
- Ask: "What almost made you purchase? What stopped you?"
- Common discoveries: Objections you didn't know existed, confusion about what you offer, comparison shopping patterns
- Expected impact: Insights that drive 20-50% conversion improvement
Conversion Optimization Prioritization Matrix:
Not all conversion improvements are equal. Prioritize based on impact and implementation complexity:
For Revenue Plateaus
Revenue plateaus are uniquely dangerous because they can persist while all other metrics look healthy. The solution requires optimizing the customer lifetime, not just the acquisition.
The Revenue Growth Formula:
Revenue = (New Customers × First Purchase Value) + (Existing Customers × Repeat Purchase Value × Purchase Frequency)
When revenue plateaus despite healthy acquisition, the problem is always in the second half of this equation.
Strategic Approaches:
-
Increase purchase frequency: What would get customers to buy more often?
- Subscription models: Convert one-time buyers to recurring customers
- Replenishment reminders: Automated emails when customers likely need to reorder
- Loyalty programs: Points/rewards that incentivize faster repeat purchase
- Content/education: Keep your brand top-of-mind between purchases
- Expected impact: 30-80% increase in repeat purchase rate
-
Expand average order value: Can you bundle, upsell, or create premium tiers?
- Product bundling: "Complete the solution" packages at discount
- Tiered pricing: Good/better/best options (most choose middle)
- Threshold incentives: "Free shipping over $75" drives larger baskets
- Post-purchase upsells: "Customers who bought X also bought Y"
- Expected impact: 15-35% increase in average order value
-
Extend customer lifetime: What's causing churn, and how can you reduce it?
- Interview churned customers: What would have made them stay?
- Identify at-risk signals: Engagement drop, support tickets, delayed payments
- Proactive retention: Reach out before they churn with offers or solutions
- Customer success programs: Ensure they're getting value, especially early
- Expected impact: 20-50% reduction in churn rate
-
Launch new products: Sometimes the only way to grow revenue is to give existing customers more to buy
- Adjacent products: Natural complements to existing purchases
- Premium tiers: Higher-end versions for best customers
- Services: Add consulting, implementation, or managed services
- Marketplace: Enable third parties to sell through your platform
- Expected impact: 25-100% increase in revenue per customer
Revenue Optimization Sequence:
The order matters. Here's the proven sequence for breaking revenue plateaus:
The Compounding Effect:
These strategies compound. A customer who:
- Buys every 90 days (vs. once per year) = 4x revenue
- Orders $100 instead of $75 = 1.33x revenue
- Stays 3 years instead of 1 year = 3x revenue
Combined impact: 4 × 1.33 × 3 = 16x customer lifetime value increase
Even achieving 50% of these targets (2x frequency, 1.17x AOV, 2x lifetime) yields 4.7x LTV improvement—which is the difference between a stalled business and explosive growth.
"The hardest part of breaking through a plateau is accepting that what got you here won't get you there. The strategies that drove your early growth are often the same strategies holding you back."
When to Accept vs. Fight
Not every plateau should be broken. Sometimes a plateau represents a natural equilibrium—a sustainable business that generates consistent returns. Trying to force growth beyond this point can destabilize what's working.
The decision to accept or fight a plateau is strategic, not emotional. Use this framework:
Accept the Plateau When:
1. The business is profitable and sustainable
- Profit margins are healthy (15%+ for most businesses)
- Cash flow is positive and predictable
- The current scale supports desired lifestyle/returns
- Breaking through would require margin compression that eliminates profitability
Example: A boutique consulting firm plateaus at $2.5M annual revenue with 55% profit margins. Partners earn $400K+ each working 40-hour weeks. Scaling to $5M would require hiring, systems, and overhead that would reduce margins to 25% while increasing workload—making partners worse off financially and personally.
2. Breaking through would require disproportionate investment
- ROI calculation shows 3+ year payback on growth investment
- Growth requires capital you don't have or can't raise efficiently
- Opportunity cost of growth investment exceeds alternative uses of capital
- Risk-adjusted return doesn't justify the investment
Example: An e-commerce business could invest $500K in inventory, warehouse expansion, and team growth to break from $3M to $6M revenue. But analysis shows 4-year payback period with significant execution risk. Alternative: invest that $500K in index funds at 8% annual return with no execution risk.
3. Growth would compromise quality or culture
- Service quality requires founder involvement that doesn't scale
- Company culture is optimized for current size and would degrade with growth
- Customer experience depends on high-touch interactions
- The thing that makes you special can't be replicated at scale
Example: A specialty manufacturer plateaus at $8M with reputation for craftsmanship. Scaling would require outsourcing production to meet demand, but this would compromise the quality that drives their premium pricing and brand reputation.
4. The market genuinely can't support more growth
- You've captured >20% of addressable market
- Category is declining, not growing
- New market entry would require completely different business model
- Adjacent segments don't align with core capabilities
Example: A regional newspaper dominates their local market with 34% share. The newspaper industry is declining 8-12% annually. Breaking through would require pivoting to digital media—essentially becoming a different business.
Fight Through the Plateau When:
1. Competitors are still growing in your space
- Other players are successfully scaling
- New entrants are capturing market share
- Industry is growing even if you're not
- Your plateau represents loss of competitive position
Red Flag: If the market is growing 15% annually but you're flat, you're actually declining in relative terms.
2. You haven't exhausted obvious opportunities
- There are clear, untested growth levers (channels, segments, offers)
- You're operating far below market benchmarks for conversion, retention, or LTV
- Low-hanging fruit exists that you've been too busy to pursue
- Quick wins could unlock growth without major investment
Example: You're running Google Ads but haven't built SEO content, haven't tested Facebook ads, haven't implemented email automation, and haven't optimized your checkout flow. The plateau isn't a market ceiling—it's execution gaps.
3. The plateau is the result of fixable problems
- Root cause analysis identifies specific, addressable issues
- Problems are operational, not market-based
- Solutions have clear ROI and reasonable implementation timelines
- Other businesses have solved similar problems successfully
Example: Your plateau is caused by checkout abandonment rate of 78% (vs. industry average of 65%). This isn't a market problem—it's a user experience problem with known solutions.
4. Staying flat means eventually declining
- Customer acquisition costs are rising faster than LTV
- Competition is intensifying, forcing margin compression
- Technology or market shifts will make current position untenable
- Plateau today = decline tomorrow given market trajectory
Example: Your business depends on Facebook ads, which have increased in cost 35% year-over-year. Staying flat means your margins compress until the business becomes unprofitable. Breaking through requires channel diversification—not optional, but necessary for survival.
The Decision Framework
Use this scoring model to decide whether to fight or accept:
Interpretation:
- 7.5-10.0: Fight the plateau aggressively
- 5.0-7.4: Fight selectively (test, learn, scale what works)
- 3.0-4.9: Accept plateau, optimize for profitability
- 0-2.9: Accept plateau, consider exit or transition
The key insight: Plateaus aren't inherently good or bad. They're decision points. Fighting through requires understanding why you're plateaued, what breaking through would take, and whether the juice is worth the squeeze.
Ready to Break Through?
If your business has hit a plateau and you're not sure why—or what to do about it—let's talk. We'll help you diagnose the cause and develop a strategy to reignite growth.
Need expert guidance on your specific growth challenges? Book a growth consulting session to work through your plateau diagnosis and action plan with our team.