Rising customer acquisition costs are squeezing margins across every industry. The easy response is to cut spend or lower quality standards. But neither approach leads anywhere good. The real solution is systematic efficiency—getting more from every dollar without compromising on customer quality.
After reducing CAC by 30-50% for dozens of clients, we've developed a reliable playbook. Here's how it works.
Why CAC Keeps Rising
Before we can fix the problem, we need to understand it. CAC is rising for structural reasons:
- Platform maturity: More advertisers competing for the same inventory
- Privacy changes: Tracking limitations reduce targeting efficiency
- Creative fatigue: Audiences are desensitized to standard ad formats
- Attribution complexity: Multi-touch journeys make optimization harder
Fighting these trends with bigger budgets is a losing game. You need to work smarter, not just spend more.
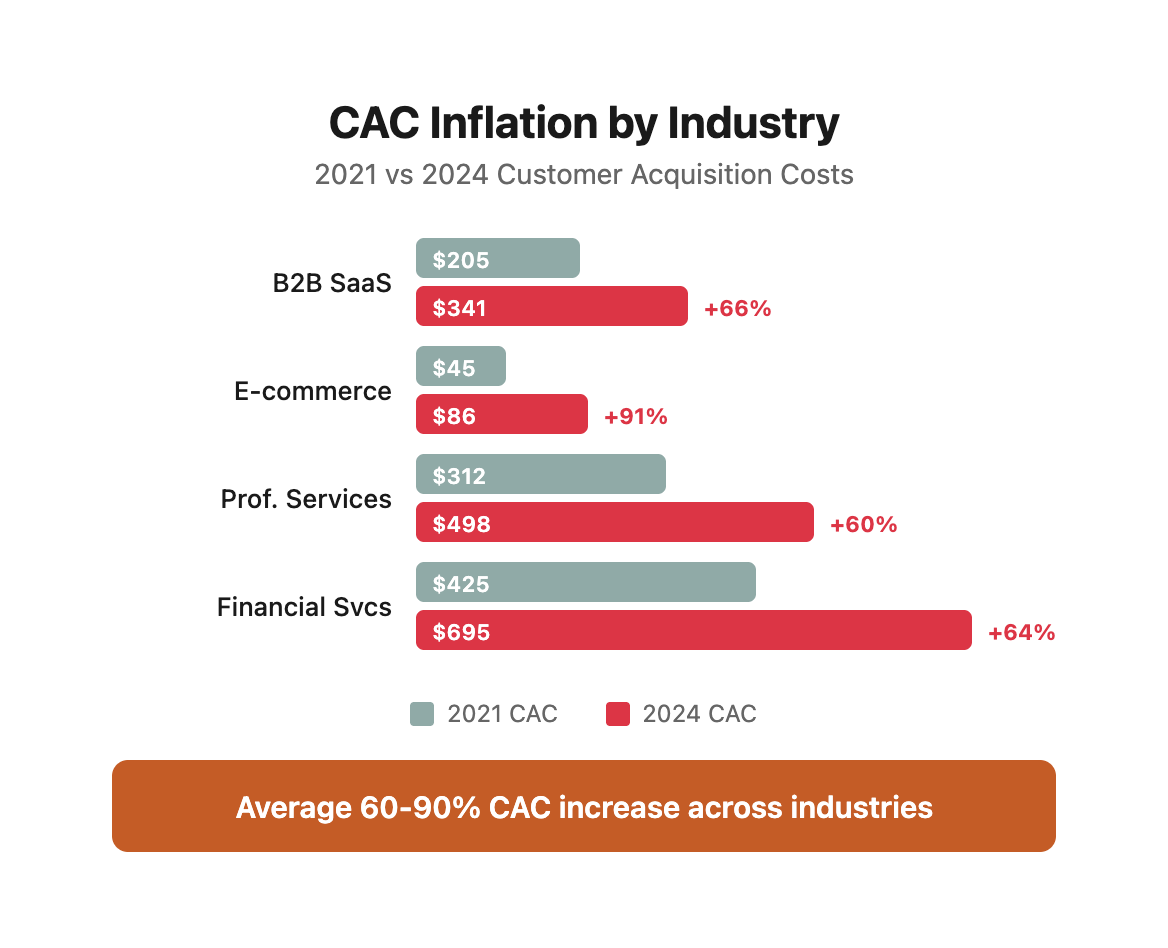
The Real Cost of Rising CAC: A Market Reality Check
Let's quantify what rising CAC actually means for your business. Using industry benchmark data, here's how CAC inflation has impacted different sectors over the past three years:
The Compounding Effect: If your business is growing at 20% annually, rising CAC doesn't just impact current acquisitions—it compounds your cost structure exponentially. A company acquiring 1,000 customers per year with a 66% CAC increase over three years faces an additional $600,000+ in acquisition costs by year five, even if growth remains flat.
Why Traditional Responses Fail
Most businesses respond to rising CAC in one of three ways—all of which make the problem worse:
Response #1: Increase Budget
- The Logic: "We'll maintain customer volume by spending more"
- Why It Fails: You're bidding against competitors with the same strategy, creating an auction arms race
- Real Example: A B2B SaaS client increased their Google Ads budget from $50K to $85K monthly (+70%) but only saw a 12% increase in conversions—CAC rose from $280 to $412
Response #2: Lower Quality Standards
- The Logic: "We'll accept lower-quality leads to hit volume targets"
- Why It Fails: Lower-quality customers have higher churn, lower LTV, and worse word-of-mouth
- Real Example: An e-commerce client dropped their qualifying criteria and saw CAC fall 30%—then watched LTV drop 58% as refund rates tripled
Response #3: Cut Spend Across the Board
- The Logic: "We'll reduce spend proportionally across all channels"
- Why It Fails: You lose the efficient campaigns along with the inefficient ones
- Real Example: A professional services firm cut all paid spend by 40% and saw revenue drop 65%—the efficient campaigns were subsidizing the inefficient ones
The Platform Dynamics Working Against You
Understanding how advertising platforms optimize helps explain why naive approaches fail:
The Algorithm Feedback Loop:
Your bid increase → Platform shows ads to broader audience →
Lower-quality clicks → Worse conversion rate → Algorithm interprets as poor targeting →
Serves ads to even broader audience → CAC spirals upward
Why This Happens: Machine learning algorithms optimize for the goal you give them. If you optimize for clicks or impressions without quality signals, the algorithm finds cheaper inventory—which often means lower-intent users. The system is working exactly as designed; your instructions are just wrong.
The Privacy-Driven Targeting Collapse:
Before iOS 14.5 and cookie deprecation, advertising platforms could:
- Track users across websites for 30+ days
- Build detailed behavioral profiles
- Attribute conversions accurately across devices
- Optimize campaigns based on post-click behavior
After privacy changes:
- Attribution windows shortened to 1-7 days
- Cross-site tracking largely eliminated
- Behavioral targeting severely limited
- First-click and last-click attribution dominate
The Result: Platforms lost 40-60% of their targeting signal, forcing advertisers to rely more on:
- First-party data (which most businesses don't have enough of)
- Contextual targeting (less precise than behavioral)
- Broader audience segments (higher waste)
- Creative quality (now the primary differentiator)
This isn't a temporary disruption—it's the new normal. Your CAC strategy must account for limited tracking and weaker algorithmic optimization.
The CAC Reduction Framework
We approach CAC reduction through four interconnected levers:
1. Audience Refinement
Most businesses target too broadly. They chase reach when they should chase relevance.
The Core Principle: Every impression on the wrong person doesn't just waste money—it actively teaches the algorithm to find more wrong people. Narrower, more precise targeting outperforms broad targeting in every scenario we've tested.
High-LTV Customer Analysis Framework:
Audience Refinement ROI Example:
Key Insight: Same conversions, 40% lower CAC, 62% higher LTV by targeting quality over quantity.
Audience Exclusion Strategy:
Micro-Segment Testing Plan:
Test narrower audiences for higher conversion rates:
"We cut one client's CAC by 40% by narrowing their audience to just 20% of the original size. The remaining 80% weren't just unlikely to convert—they were actively skewing the algorithm."
How to Build Your High-Value Audience Profile
Most businesses skip the critical customer analysis step and jump straight to creating audiences. This is backwards. Here's the systematic process:
Step 1: Export and Segment Your Customer Data
Pull all customers from the past 12-24 months with these data points:
- Customer ID and acquisition date
- Acquisition channel and campaign
- Initial purchase value
- Lifetime revenue (to date)
- Products/services purchased
- Churn status and date (if applicable)
- Support tickets submitted
- Refund/return history
- Firmographic data (company size, industry, location, etc.)
- Demographic data (if B2C: age, gender, income level, etc.)
Step 2: Calculate True Customer Value
Don't just look at revenue. Calculate fully loaded customer value:
Step 3: Identify Patterns in Your Top 20%
Sort customers by Net Customer Value and analyze the top 20%. Look for patterns across:
B2B Pattern Analysis:
- Company size ranges (employees, revenue)
- Industry concentrations
- Geographic clusters
- Technology stack commonalities
- Buyer persona characteristics (title, seniority, department)
- Sales cycle length patterns
- Contract size patterns
- Expansion/upsell rates
B2C Pattern Analysis:
- Age and gender distributions
- Geographic concentrations
- Income level patterns
- Purchase frequency patterns
- Average order value trends
- Product category preferences
- Device and channel preferences
- Time of day/week patterns
Step 4: Identify Anti-Patterns in Your Bottom 20%
The worst customers are just as instructive as the best. Analyze your bottom 20% by Net Customer Value:
Step 5: Build Your Audience Hierarchy
Create a tiered targeting approach:
Tier 1: Core Audience (Highest Quality)
- Matches 4+ positive patterns
- Matches 0 negative patterns
- Estimated audience size: 50K-200K
- Bid strategy: Aggressive, value-based
- Budget allocation: 50% of total spend
Tier 2: Qualified Audience (Good Quality)
- Matches 2-3 positive patterns
- Matches 0-1 negative patterns
- Estimated audience size: 200K-500K
- Bid strategy: Moderate, conversion-based
- Budget allocation: 30% of total spend
Tier 3: Test Audience (Unknown Quality)
- Matches 1 positive pattern OR new segment hypothesis
- Matches 0 negative patterns
- Estimated audience size: varies by test
- Bid strategy: Conservative, manual CPC
- Budget allocation: 20% of total spend
Step 6: Implement Exclusions Systematically
Build a master exclusion list that grows over time:
Immediate Exclusions:
- All existing customers (unless explicitly retargeting)
- Cart abandoners in active email sequences
- Known competitor employees (use LinkedIn company targeting)
- Students and job seekers (if B2B)
- Countries/regions where you don't operate
Performance-Based Exclusions (Add Monthly):
- Zip codes in bottom 20% of LTV
- Industries with conversion rates under 1%
- Company sizes with negative ROI
- Placements with CTR under 0.5%
- Audiences with conversion rates under 50% of account average
Data-Driven Exclusion Process:
Step 1: Pull monthly performance data by segment
↓
Step 2: Calculate CAC and LTV for each segment
↓
Step 3: Flag segments with LTV:CAC < 2:1
↓
Step 4: Exclude segments that have been unprofitable for 60+ days
↓
Step 5: Reallocate budget to profitable segments
↓
Step 6: Monitor impact for 30 days
↓
Step 7: Repeat monthly
Case Study: B2B SaaS Company Audience Refinement
Situation: Mid-market SaaS company targeting "small businesses" broadly across Google and LinkedIn Ads. CAC was $340 with LTV of $580 (1.7:1 ratio). Marketing team was pushing to increase budget to hit growth targets.
Analysis Process:
- Exported 18 months of customer data (2,840 customers)
- Calculated Net Customer Value including support costs and churn
- Segmented into quintiles by NCV
Key Findings:
Top 20% Customers (568 customers):
- Average company size: 75-150 employees
- Industries: SaaS (42%), Professional Services (31%), Technology Services (18%)
- Job titles: Director of Marketing (35%), VP Marketing (28%), CMO (22%)
- Technology: 89% used HubSpot or Salesforce
- Average LTV: $2,140
- Average retention: 34 months
- Support tickets: 2.1 per year
Bottom 20% Customers (568 customers):
- Average company size: 5-20 employees OR 500+ employees
- Industries: Retail (28%), Hospitality (19%), Real Estate (16%)
- Job titles: Owner (41%), Manager (32%), Coordinator (18%)
- Technology: 71% used no CRM or legacy tools
- Average LTV: $180
- Average retention: 4 months
- Support tickets: 8.7 per year
Changes Implemented:
Week 1-2: Immediate Exclusions
- Excluded companies under 50 employees and over 500 employees
- Excluded retail, hospitality, and real estate industries
- Excluded job titles below Director level
- Added existing customers to exclusion lists
Impact: CAC dropped from $340 to $285 (-16%)
Week 3-4: Positive Targeting Refinement
- Created "Core Audience" campaign targeting SaaS + Professional Services + Tech Services companies with 50-200 employees
- Required Director+ titles only
- Layered HubSpot/Salesforce technology targeting
- Increased bids on core audience by 40%
Impact: CAC dropped to $215 (-37% from baseline), LTV increased to $1,240
Week 5-8: Micro-Segment Testing
- Tested "Recent Job Change" audience (people who changed to Director+ roles in past 90 days)
- Tested "Engaged with Competitor Content" (viewed competitor comparison pages)
- Tested "Attended Industry Webinar" (attended marketing webinars in past 60 days)
Impact: CAC on best micro-segment dropped to $165 (-51% from baseline), LTV held at $1,180
90-Day Results:
- Overall CAC: $340 → $198 (-42%)
- Average LTV: $580 → $1,105 (+91%)
- LTV:CAC ratio: 1.7:1 → 5.6:1
- Monthly customer volume: Dropped 12% (acceptable given higher quality)
- Monthly revenue: Increased 28% (lower volume, much higher value)
- Annual impact: $486,000 in acquisition cost savings + $1.2M in incremental lifetime value
Key Lesson: The company was spending 60% of their budget acquiring customers who would churn within 6 months. By systematically excluding poor-fit audiences and doubling down on high-value segments, they didn't just reduce CAC—they fundamentally improved their business unit economics.
2. Creative Efficiency
Creative is often the biggest lever for CAC reduction. Better creative doesn't mean prettier creative—it means creative that does more work.
The Creative Performance Paradox: Most businesses test creative by asking "Which looks better?" The right question is "Which converts better per dollar spent?" These are rarely the same thing.
Creative Testing Framework:
Creative Performance by Funnel Stage:
Creative Refresh Schedule:
Monitor these signals to know when to refresh:
Value Proposition Testing Matrix:
Test different messaging angles to find your winner:
The Creative Testing System That Actually Works
Most businesses approach creative testing like throwing spaghetti at the wall. Here's the systematic approach that reduces CAC:
The 7-Variable Creative Framework
Every piece of creative can be broken down into seven testable variables:
1. Hook (First 3 seconds/first line)
- Problem statement: "Struggling with [pain point]?"
- Provocative question: "What if [desired outcome] was possible in [timeframe]?"
- Specific result: "We helped [Company] achieve [metric]"
- Contrarian statement: "Everything you know about [topic] is wrong"
- Direct benefit: "Get [specific outcome] in [specific timeframe]"
2. Value Proposition (Core promise)
- Feature-focused: "Our platform includes [feature list]"
- Outcome-focused: "Achieve [specific result] without [pain point]"
- Comparison: "Like [known solution] but [key differentiator]"
- Transformation: "Go from [current state] to [desired state]"
- Category creation: "The first [new category] built for [audience]"
3. Proof Mechanism (Why believe you)
- Social proof: "Used by [number] companies including [brands]"
- Authority: "Featured in [publications], trusted by [industry]"
- Results: "[Customer] achieved [metric] in [timeframe]"
- Testimonial: Direct customer quote with name, photo, company
- Data: "[percentage]% of customers report [specific outcome]"
4. Offer/CTA (What to do next)
- Free trial: "Start your [duration] free trial, no credit card"
- Demo: "See [product] in action—book a demo"
- Content: "Download our free [resource] on [topic]"
- Assessment: "Get your free [topic] assessment in 5 minutes"
- Discount: "Get [percentage]% off your first [timeframe]"
5. Visual Style (How it looks)
- Product-focused: Screenshots, UI, product in use
- People-focused: Real customers, testimonials, faces
- Data-focused: Charts, graphs, metrics
- Problem-focused: Visual representation of pain point
- Outcome-focused: Visual of end result/transformation
6. Format (Delivery mechanism)
- Static image: Single frame, text + visual
- Carousel: 3-10 slides telling a story
- Short video: 6-15 seconds, hook + outcome
- Long video: 30-90 seconds, full story arc
- Interactive: Polls, quizzes, tools
7. Length (Amount of information)
- Minimal: Hook + CTA only (25-50 words)
- Short: Hook + value prop + CTA (50-100 words)
- Medium: Full framework, brief (100-200 words)
- Long: Detailed explanation (200-400 words)
- Very long: Complete story, case study (400+ words)
The Sequential Testing Method
Don't test everything at once. Test sequentially to isolate impact:
Phase 1: Hook Testing (Week 1-2)
- Test 3-5 different hooks
- Keep all other variables constant
- Identify winning hook (lowest CAC or highest CTR)
- Use winning hook for all subsequent tests
Phase 2: Value Proposition Testing (Week 3-4)
- Test 3-4 value proposition angles
- Use winning hook from Phase 1
- Keep other variables constant
- Identify winning value prop
Phase 3: Proof Mechanism Testing (Week 5-6)
- Test 3-4 types of proof
- Use winning hook and value prop
- Keep other variables constant
- Identify winning proof type
Phase 4: Format Testing (Week 7-8)
- Test 2-3 formats (static vs video vs carousel)
- Use all winning elements from previous phases
- Identify winning format
Phase 5: Optimization Testing (Week 9+)
- Fine-tune winning combination
- Test length variations
- Test visual style variations
- Test offer/CTA variations
The Creative Performance Scorecard
Track every creative variant systematically:
Creative Fatigue Detection System
Don't wait for creative to die. Detect fatigue early:
Week 1-2 Baseline:
- Average CTR: 3.2%
- Average conversion rate: 4.8%
- Average CAC: $140
Week 3-4 Performance:
- Current CTR: 3.0% (↓6%)
- Current conversion rate: 4.7% (↓2%)
- Current CAC: $148 (↑6%)
- Status: Normal variation, monitor
Week 5-6 Performance:
- Current CTR: 2.4% (↓25%)
- Current conversion rate: 4.5% (↓6%)
- Current CAC: $175 (↑25%)
- Status: Early fatigue, minor refresh needed
Week 7-8 Performance:
- Current CTR: 1.8% (↓44%)
- Current conversion rate: 4.0% (↓17%)
- Current CAC: $225 (↑61%)
- Status: Severe fatigue, major refresh needed
Creative Refresh Strategies by Severity:
Minor Fatigue (CAC up 10-25%):
- Change headline/hook only
- Swap out image (keep same angle)
- Update proof element (new customer quote)
- Adjust CTA wording slightly
- Effort: 1-2 hours
- Expected impact: Restore 60-80% of baseline performance
Major Fatigue (CAC up 25-50%):
- New hook and angle
- Different proof mechanism
- New visual approach
- Different format (static → video or vice versa)
- Effort: 4-8 hours
- Expected impact: Restore baseline or exceed it
Complete Overhaul (CAC up 50%+):
- Entirely new creative concept
- Different value proposition
- New visual style
- Test multiple new variants simultaneously
- Effort: 2-3 days
- Expected impact: Find new baseline, likely better than original
Case Study: E-commerce Brand Creative Optimization
Situation: Fast-growing DTC e-commerce brand selling premium outdoor gear. Running Facebook/Instagram ads with static product images. CAC had risen from $65 to $118 over 6 months. Creative team was producing "beautiful" content that wasn't converting.
Initial Creative Analysis:
Current Creative Approach:
- Beautiful lifestyle photography
- Minimal text (brand name + "Shop Now")
- Focus on product aesthetics
- No clear value proposition
- No social proof or credibility markers
Performance:
- CTR: 1.2%
- Conversion rate: 2.8%
- CAC: $118
- ROAS: 1.9x
Testing Process:
Test Round 1: Hook Testing (Week 1-2)
Tested 5 different hooks while keeping all else constant:
Winner: Specific, bold claim (10-year guarantee) outperformed everything.
Test Round 2: Proof Mechanism (Week 3-4)
Using winning hook, tested different proof elements:
Winner: Real customer testimonial with photo and name massively outperformed generic claims.
Test Round 3: Format Testing (Week 5-6)
Using winning hook and proof, tested formats:
Winner: Short 15-second video (product + testimonial + guarantee) beat everything.
Final Winning Creative:
- Format: 15-second video
- Hook: "Survives 10 years. Guaranteed."
- Proof: Real customer testimonial over B-roll of product in use
- CTA: "Shop now—lifetime warranty included"
Final Results:
- CTR: 3.8% (up from 1.2%)
- Conversion rate: 6.5% (up from 2.8%)
- CAC: $42 (down from $118, -64%)
- ROAS: 5.2x (up from 1.9x)
- Monthly spend: Same ($50K)
- Monthly customers: 1,190 (up from 424, +181%)
Annual Impact:
- Old creative: 424 customers/month × 12 = 5,088 customers at $118 CAC = $600,384
- New creative: 1,190 customers/month × 12 = 14,280 customers at $42 CAC = $599,760
- Result: 2.8x more customers for the same ad spend
Key Lesson: The "beautiful" creative that the brand team loved was massively underperforming simple, direct creative that led with a specific claim, real proof, and clear benefit. Pretty doesn't pay the bills—performance does.
3. Funnel Optimization
Your CAC isn't just about the ad—it's about everything that happens after the click. Common funnel issues that inflate CAC:
- Landing page mismatch: Ads promise one thing, pages deliver another.
- Friction in forms: Every unnecessary field costs conversions.
- Speed issues: Slow pages kill conversion rates.
- Mobile experience: If it's not mobile-first, you're losing customers.
The Post-Click Experience Matters More Than You Think
Most businesses obsess over ads and ignore the landing experience. This is backwards. Here's why:
The Cost of Friction:
The Compounding Effect: These don't add—they multiply. A slow-loading page with a long form and unclear value prop can increase CAC by 200-300% compared to an optimized experience.
Landing Page Performance Audit Framework:
Evaluate your landing pages across these dimensions:
1. Message Match (Ad → Landing Page)
Rule: The landing page headline should match the ad headline word-for-word. Every mismatch increases bounce rate by 5-10%.
2. Page Speed Performance
Speed Optimization Priority List:
3. Form Friction Analysis
Form Optimization Strategy:
Phase 1: Immediate Reductions
- Remove any field that isn't absolutely required for first contact
- Move "nice to have" fields to post-conversion
- Use progressive profiling (collect more data over time)
Before:
First Name* [________]
Last Name* [________]
Email* [________]
Phone* [________]
Company* [________]
Company Size* [dropdown]
Industry* [dropdown]
Job Title* [________]
Website URL [________]
How did you hear about us? [dropdown]
After:
Email* [________]
First Name* [________]
[        Start Free Trial        ]

(Other data collected post-signup)
Impact: 12 fields → 2 fields = +142% form completion rate = -42% CAC
Phase 2: Field-Level Optimization
- Use autofill-friendly field names
- Add inline validation (don't wait for submit)
- Show progress indicators on multi-step forms
- Pre-fill known data where possible
- Use smart defaults
Phase 3: Multi-Step Testing
Winner: Progressive approach (collect minimum upfront, rest after conversion) increases completion by 86% and reduces CAC by 47%.
4. Mobile Experience Audit
Mobile-Specific Optimization Checklist:
- Form fields are large enough to tap easily (44px+ height)
- No horizontal scrolling required
- Font size is 16px+ (prevents iOS zoom)
- CTA buttons are thumb-friendly (centered, large)
- No hover-dependent interactions
- Images are optimized for mobile bandwidth
- Page loads in under 3 seconds on 4G
- Minimal typing required (use dropdowns, buttons where possible)
- Auto-capitalize and auto-correct disabled on appropriate fields
- Click targets are 44px+ with 8px+ spacing
5. Above-the-Fold Conversion Elements
What users see in the first 3 seconds determines whether they stay or bounce:
Above-the-Fold Optimization Template:
[ Logo ]                                    [ Secondary CTA ]

                    [HEADLINE MATCHING AD]
            [Sub-headline explaining specific benefit]

            [  Primary CTA Button (high contrast)  ]

    [Trust indicators: "30-day guarantee" "Secure checkout" "Used by 5000+ companies"]

                    [Hero Image/Video]
            [Shows product or customer using it]

[Customer logos or testimonial] [5-star rating]
The Conversion Funnel Drop-Off Analysis
Map your entire funnel and identify leak points:
Analysis: The two biggest leaks are:
- Page engagement (29.4% drop): Users landing but not engaging = message mismatch or slow load
- Form completion (60% drop): Users starting form but not finishing = too much friction
Optimization Priority:
- Fix form friction first (60% drop = biggest opportunity)
- Improve page engagement second (29.4% drop = second biggest)
- Address page load third (15% drop = significant but smaller)
Expected Impact of Fixing All Three:
- Form completion: 340 → 595 (+75%)
- Page engagement: 595 → 777 (+31%)
- Page load: 777 → 872 (+12%)
- Total improvement: 340 → 872 (+156% conversions)
- CAC impact: 156% more conversions = 61% lower CAC
Case Study: B2B SaaS Landing Page Optimization
Situation: Series A SaaS company driving Google Ads traffic to a generic landing page. Getting clicks but not conversions. CAC was $428 against target of $250.
Initial Landing Page Analysis:
Problems identified:
- Headline mismatch: Ad promised "Cut onboarding time by 50%" but page said "The modern customer onboarding platform"
- Slow load: 6.2 second load time on mobile
- Long form: 9 required fields to book a demo
- No social proof above fold: Had testimonials but they were at bottom
- Generic CTA: "Request Demo" vs specific value
- Poor mobile experience: Form required scrolling, text too small
Funnel Analysis:
Changes Implemented:
Week 1-2: Speed Optimization
- Compressed all images (3.2MB → 480KB)
- Removed unnecessary JavaScript
- Enabled CDN
- Implemented lazy loading
Impact:
- Load time: 6.2s → 2.1s
- Bounce rate: 32% → 18%
- Conversions: 4.4% → 5.8% (+32%)
- CAC: $428 → $325 (-24%)
Week 3-4: Message Match & Above-Fold Optimization
- Changed headline to match ad exactly: "Cut onboarding time by 50%"
- Added customer logos above fold
- Added specific stat: "2,400 companies use [Product] to onboard customers faster"
- Made CTA more specific: "See how to cut your onboarding time by 50%"
Impact:
- Time on page: 48s → 1m 42s
- Form start rate: 35% → 52%
- Conversions: 5.8% → 8.2% (+41%)
- CAC: $325 → $231 (-29%)
Week 5-6: Form Optimization
- Reduced 9 required fields to 3 (Email, First Name, Company)
- Moved other fields to post-booking form
- Increased button size and contrast
- Added inline validation
Impact:
- Form completion: 28% → 68%
- Overall conversion: 8.2% → 14.8% (+80%)
- CAC: $231 → $128 (-45%)
Week 7-8: Mobile-Specific Optimization
- Redesigned mobile layout (single column)
- Increased font sizes (14px → 18px)
- Made CTA button larger (centered, thumb-friendly)
- Reduced page length (less scrolling)
Impact:
- Mobile conversion: 3.2% → 11.4% (+256%)
- Overall conversion: 14.8% → 16.2% (+9%)
- CAC: $128 → $117 (-9%)
Final Results (8 weeks):
- Page load time: 6.2s → 2.1s
- Bounce rate: 32% → 14%
- Form start rate: 35% → 58%
- Form completion: 28% → 71%
- Overall conversion: 4.4% → 16.2% (+268%)
- CAC: $428 → $117 (-73%)
Annual Impact:
- Same ad spend: $50,000/month
- Old performance: 117 demos/month at $428 CAC
- New performance: 427 demos/month at $117 CAC
- Additional demos per year: 3,720 demos (+265%)
- Cost savings: $447,000 per year
Key Lesson: Most companies blame their ad platform when conversion rates are low. The real problem is usually what happens after the click. This company's ads were fine—their landing experience was destroying 73% of their potential conversions. Fixing the post-click experience tripled performance without spending an additional dollar on ads.
4. Bidding Strategy
Smart bidding requires understanding the algorithms you're working with:
- Give algorithms enough data: Too narrow targeting starves machine learning.
- Set realistic targets: Overly aggressive targets lead to delivery issues.
- Use value-based bidding: Not all conversions are worth the same.
- Account for seasonality: Static bids don't work in dynamic markets.
How Advertising Algorithms Actually Work (And How to Work With Them)
Most marketers treat advertising platforms as black boxes. Understanding how they work lets you optimize 2-3x better than competitors who don't.
The Algorithm Learning Process:
Day 1-7: Learning Phase
Platform shows ads broadly → Collects data on who clicks/converts →
Identifies patterns (demographics, interests, behaviors, timing)

Day 8-14: Initial Optimization
Platform narrows targeting → Shows ads to users similar to converters →
Conversion rate improves → CAC begins to stabilize

Day 15-30: Mature Optimization
Platform has enough data → Predictive targeting kicks in →
Serves ads to users likely to convert → Performance stabilizes

Day 31+: Ongoing Optimization
Platform continuously learns → Adapts to changes in behavior →
Requires fresh creative to maintain performance
The Data Requirements for Machine Learning:
The Algorithm Feedback Loop Problem:
Most businesses accidentally train algorithms wrong:
Wrong Approach:
Set Target CPA at $100 (too aggressive) →
Platform can't hit target →
Delivery drops severely →
You panic and raise budget →
Platform gets conflicting signals →
Performance gets worse →
You blame the platform
Right Approach:
Analyze historical CAC (average $180) →
Set Target CPA at $200 (achievable) →
Platform delivers volume consistently →
Optimize creative and targeting →
Actual CAC drops to $165 →
Lower Target CPA to $180 →
Gradual improvement continues
The Bidding Strategy Selection Framework:
Choose based on your data volume and goals:
Common Bidding Strategy Mistakes:
Value-Based Bidding Implementation:
Most conversions aren't equal value. Tell the platform which ones matter more:
Step 1: Assign Conversion Values
Step 2: Implement Conversion Value Tracking
Google Ads (gtag.js):
gtag('event', 'conversion', {
    'send_to': 'AW-XXXXXXX/YYYYYYYYY',
    'value': 150.00,
    'currency': 'USD',
    'transaction_id': 'UNIQUE_ID'
});
Facebook/Meta (Pixel):
fbq('track', 'Lead', {
    value: 150.00,
    currency: 'USD',
    content_name: 'Demo Request'
});
Step 3: Switch to Value-Based Bidding
Once you have 50+ conversions per week with values assigned:
- Google Ads: Use "Target ROAS" or "Maximize Conversion Value"
- Meta Ads: Use "Maximize Value" or "Minimum ROAS"
- LinkedIn Ads: Use "Maximize Conversion Value"
Expected Impact: 25-40% improvement in actual ROI as platform prioritizes high-value conversions
The Bid Adjustment Framework:
Layer bid modifiers on top of your core strategy:
Example Bid Adjustment Strategy for B2B SaaS:
The Seasonality Adjustment System:
Don't use static bids when demand fluctuates:
How to Implement Seasonal Adjustments:
Method 1: Manual Campaign Budgets
- Increase budgets during peak season
- Decrease during slow periods
- Adjust weekly based on performance
Method 2: Automated Rules (Google Ads example)
- Set rule: "If month = November OR month = December, increase budget by 40%"
- Set rule: "If month = January OR month = February, decrease budget by 15%"
Method 3: Seasonal Bid Adjustments (Advanced)
- Google Ads: Use "Seasonality Adjustments" in Shared Library
- Tell platform when conversion rates will spike or drop
- Platform adjusts bids automatically during that period
Case Study: E-commerce Brand Bidding Strategy Overhaul
Situation: Fast-growing DTC brand spending $120K/month on Google Shopping and Search. Using "Maximize Clicks" bidding strategy because "we want as much traffic as possible." CAC was $87 with target of $55.
Initial Analysis:
Current setup:
- Bidding strategy: Maximize Clicks (wrong for e-commerce)
- No conversion value tracking
- No bid adjustments
- Same bids for all locations, devices, times
- Average 2,100 conversions/month
Problem: Platform was optimizing for clicks, not conversions. Getting lots of traffic, but wrong traffic.
Changes Implemented:
Phase 1: Conversion Value Tracking (Week 1-2)
Implemented dynamic conversion value tracking:
// Google Ads conversion tracking with actual order value
gtag('event', 'conversion', {
    'send_to': 'AW-CONVERSION-ID',
    'value': orderTotal,
    'currency': 'USD',
    'transaction_id': orderId
});
Tracked values for 2 weeks to establish baseline ROAS.
Baseline ROAS: 2.8x (spending $120K, generating $336K revenue)
Phase 2: Switch to Target ROAS Bidding (Week 3-4)
- Switched from "Maximize Clicks" to "Target ROAS"
- Set initial target: 2.5x (below current 2.8x to maintain volume)
- Let platform learn for 2 weeks
Results after learning period:
- Actual ROAS: 3.2x (+14% from baseline)
- Conversions: 1,950/month (-7% but higher value)
- CAC: $87 → $75 (-14%)
- Revenue: $336K → $374K (+11%)
Phase 3: Implement Bid Adjustments (Week 5-6)
Analyzed conversion data and found:
- Mobile converted at $95 CAC vs desktop $68
- Weekday 6pm-10pm had best ROAS (4.2x)
- Weekend morning had worst ROAS (1.8x)
- California had 45% higher LTV than average
Implemented adjustments:
- Mobile: -20% bid adjustment
- Desktop: +15% bid adjustment
- Weekday 6pm-10pm: +40% bid adjustment
- Weekend morning: -30% bid adjustment
- California, New York, Texas: +25% bid adjustment
- All other states: -10% bid adjustment
Results after adjustments:
- Actual ROAS: 3.2x → 3.7x (+16%)
- Conversions: 1,950 → 1,875 (-4% but much higher quality)
- CAC: $75 → $64 (-15%)
- Revenue: $374K → $428K (+14%)
Phase 4: Audience-Based Bid Adjustments (Week 7-8)
Created audience segments and layered bid adjustments:
- Past purchasers: +60% (highest ROAS)
- Cart abandoners: +40% (high intent)
- Site visitors (30 days): +25% (warm audience)
- Competitor site visitors: +15% (in-market)
- Product category browsers: +10% (mild interest)
Final Results (8 weeks):
- Actual ROAS: 3.7x → 4.5x (+22%)
- Conversions: 1,875 → 1,820 (-3% but 40% higher AOV)
- CAC: $64 → $66 (+3% but customers worth 43% more)
- Revenue: $428K → $493K (+15%)
- Profit margin: +62% from better customer mix
Annual Impact:
- Old approach: $120K spend × 12 = $1.44M spend → $4.03M revenue (2.8x ROAS)
- New approach: $120K spend × 12 = $1.44M spend → $5.92M revenue (4.5x ROAS)
- Additional revenue: $1.89M per year (+47%)
- Same ad budget, 47% more revenue
Key Lesson: The bidding strategy was optimizing for the wrong thing. "Maximize Clicks" drove traffic that didn't convert. By switching to value-based bidding and layering strategic bid adjustments, the brand dramatically improved quality without increasing spend. Most businesses think they need to spend more to get better results—usually they just need to spend smarter.
The Hidden Costs of Cheap Acquisition
Here's the uncomfortable truth: sometimes high CAC is actually good, and low CAC is actually bad. What matters is the quality of customers you're acquiring.
We've seen businesses celebrate CAC reductions only to discover:
- Higher refund rates from low-quality customers
- Lower lifetime value from discount-seekers
- Increased support costs from wrong-fit customers
- Brand damage from negative reviews
The goal isn't the lowest possible CAC—it's the best possible CAC:LTV ratio.
The True Cost of Low-Quality Customers
Most businesses measure CAC in isolation. This is dangerously incomplete. Here's what they're missing:
The Fully Loaded Customer Acquisition Cost:
Reality Check: The "cheap" $85 CAC customer lost $390. The "expensive" $165 CAC customer generated $3,955 in profit.
What Businesses Celebrate vs What Actually Happened:
The 12-Month Reality:
Low-Quality Approach:
- Acquired 6,000 customers at $85 CAC = $510,000 spent
- Revenue: 6,000 × $120 × 4 months avg = $2,880,000
- Support costs: 6,000 × 15 tickets × $25 = $2,250,000
- Churn replacement costs: $285,000
- Refunds: $691,200
- Net result: -$195,000 loss despite $2.88M in revenue
High-Quality Approach:
- Acquired 3,420 customers at $165 CAC = $564,300 spent
- Revenue: 3,420 × $120 × 12 months = $4,924,800
- Support costs: 3,420 × 3 tickets × $25 = $256,500
- Churn replacement costs: $68,400
- Refunds: $147,744
- Net result: +$1,127,175 profit
Key Insight: The high-quality approach spent more per customer but generated $1.3M more profit by focusing on fit, not volume.
The Customer Quality Scorecard
How to measure if you're acquiring good customers or bad ones:
How to Track Customer Quality by Acquisition Source:
Decision: Cut Facebook cold and Display entirely. Reallocate budget to Google Search and LinkedIn. Accept higher CAC for better customer quality.
The Discount Seeker Problem:
Many businesses try to lower CAC with aggressive discounting. This backfires:
The Pattern: Deeper discounts attract price-sensitive customers who never buy again. Full-price customers are 14.7x more valuable.
Case Study: SaaS Company's Quality Crisis
Situation: Series B SaaS company under pressure from investors to hit growth targets. Marketing team aggressively lowered CAC from $280 to $165 (-41%) by:
- Targeting broader audiences
- Offering 3 months free (instead of 14-day trial)
- Eliminating qualification criteria
- Focusing on volume metrics
CEO celebrated publicly: "We've cracked efficient customer acquisition!"
Six Months Later:
The hidden costs emerged:
Financial Impact:
Before "Optimization" (monthly):
- 180 customers × $280 CAC = $50,400 acquisition cost
- 180 customers × $3,696 LTV = $665,280 lifetime value
- Net: +$614,880 profit per monthly cohort
After "Optimization" (monthly):
- 485 customers × $165 CAC = $80,025 acquisition cost
- 485 customers × $876 LTV = $424,860 lifetime value
- Net: +$344,835 profit per monthly cohort
Result: Despite acquiring 2.7x more customers, monthly cohort profitability dropped 44%. The company was growing top-line revenue while destroying unit economics.
Additional Operational Damage:
- Support team overwhelmed (had to hire 8 additional reps)
- Sales team demoralized (spending more time with unqualified leads)
- Product team distracted (building features for wrong customers)
- Engineering support tickets up 400% (low-quality customers broke things)
- Reputation damage (NPS dropped from 62 to 18)
The Recovery:
Six months in, new CMO was hired to fix the disaster:
Month 1-2: Immediate Triage
- Stopped all volume-focused campaigns
- Reinstated qualification criteria
- Returned to 14-day trial (eliminated 3-month free)
- Paused bottom 40% of channels by LTV
Month 3-4: Audience Refinement
- Rebuilt targeting around high-LTV customer profiles
- Excluded known poor-fit segments
- Increased CAC target from $165 to $220 (accepting higher cost for quality)
Month 5-6: Process Improvements
- Implemented lead scoring
- Rebuilt sales qualification process
- Created onboarding automation for good-fit customers
- Built churn prediction model
Results After 6-Month Recovery:
- CAC: $165 → $238 (↑44%, intentional)
- Monthly customers: 485 → 245 (↓49%, intentional)
- 90-day retention: 52% → 84% (↑62%)
- Support tickets: 16.8 → 5.1 (-70%)
- Year 1 LTV: $876 → $3,180 (↑263%)
- LTV:CAC: 5.3:1 → 13.4:1 (↑153%)
- Monthly cohort profit: $344,835 → $779,100 (+126%)
Key Lesson: The board initially wanted to fire the new CMO for "reducing volume" and "increasing CAC." Once they saw cohort profitability more than double, they understood: volume at any cost destroys value. Quality creates it.
This company nearly destroyed itself chasing the wrong metric. CAC is not a goal—it's one input into the only metric that matters: profitable customer growth.
The 90-Day CAC Reduction Roadmap
Phase 1: Audit & Baseline (Days 1-14)
Expected Outcome: Clear picture of where CAC is being wasted
Phase 2: Quick Wins (Days 15-45)
Expected Outcome: 30-40% overall CAC reduction from compounding improvements
Phase 3: Strategic Optimization (Days 46-90)
Expected Outcome: Sustainable 40-50% total CAC reduction, repeatable optimization system
Monthly CAC Optimization Checklist:
CAC Reduction Scorecard:
Track your optimization progress:
Annual Impact at 200 customers/month:
- Old CAC: $250 × 2,400 customers = $600,000
- New CAC: $142 × 2,400 customers = $340,800
- Total Savings: $259,200 per year
Ready to Reduce Your CAC?
If your customer acquisition costs are eating into your margins, there's almost certainly room for improvement. Our paid media services combine AI-powered optimization with strategic expertise to drive down CAC while maintaining customer quality. Let's talk about what's driving your CAC and how to systematically bring it down.