
After working with over 100 businesses, we've noticed a pattern: most companies have significant growth opportunities hiding in plain sight. The data is there. The insights are waiting. But without a systematic approach to finding them, they stay hidden.
Here's what this looks like in practice: A $5M revenue company came to us convinced they needed to "do more marketing." After our audit, we discovered they were actually doing too much—spreading budget across seven channels, but only three were profitable. By cutting spend on four underperforming channels and doubling down on the winners, they increased revenue by 34% while reducing overall marketing spend by 18%.
That's the power of systematic analysis over gut feeling.
That's why we developed the Growth Audit - a comprehensive framework for uncovering the opportunities that can transform your business. In this post, we'll walk you through the exact process we use with clients and show you how to apply it to your own data—whether you have a full analytics team or you're working solo.
What Is a Growth Audit?
A growth audit is a systematic examination of your marketing data, customer journey, and conversion funnel to identify gaps, inefficiencies, and untapped opportunities. Unlike a general marketing review, it's specifically focused on finding actionable insights that can drive measurable growth.
Think of it as the difference between a routine physical and diagnostic testing. A marketing review tells you your vital signs—traffic is up, conversion rate is 2.3%, email open rate is 18%. A growth audit diagnoses why those numbers are what they are and prescribes specific treatments.
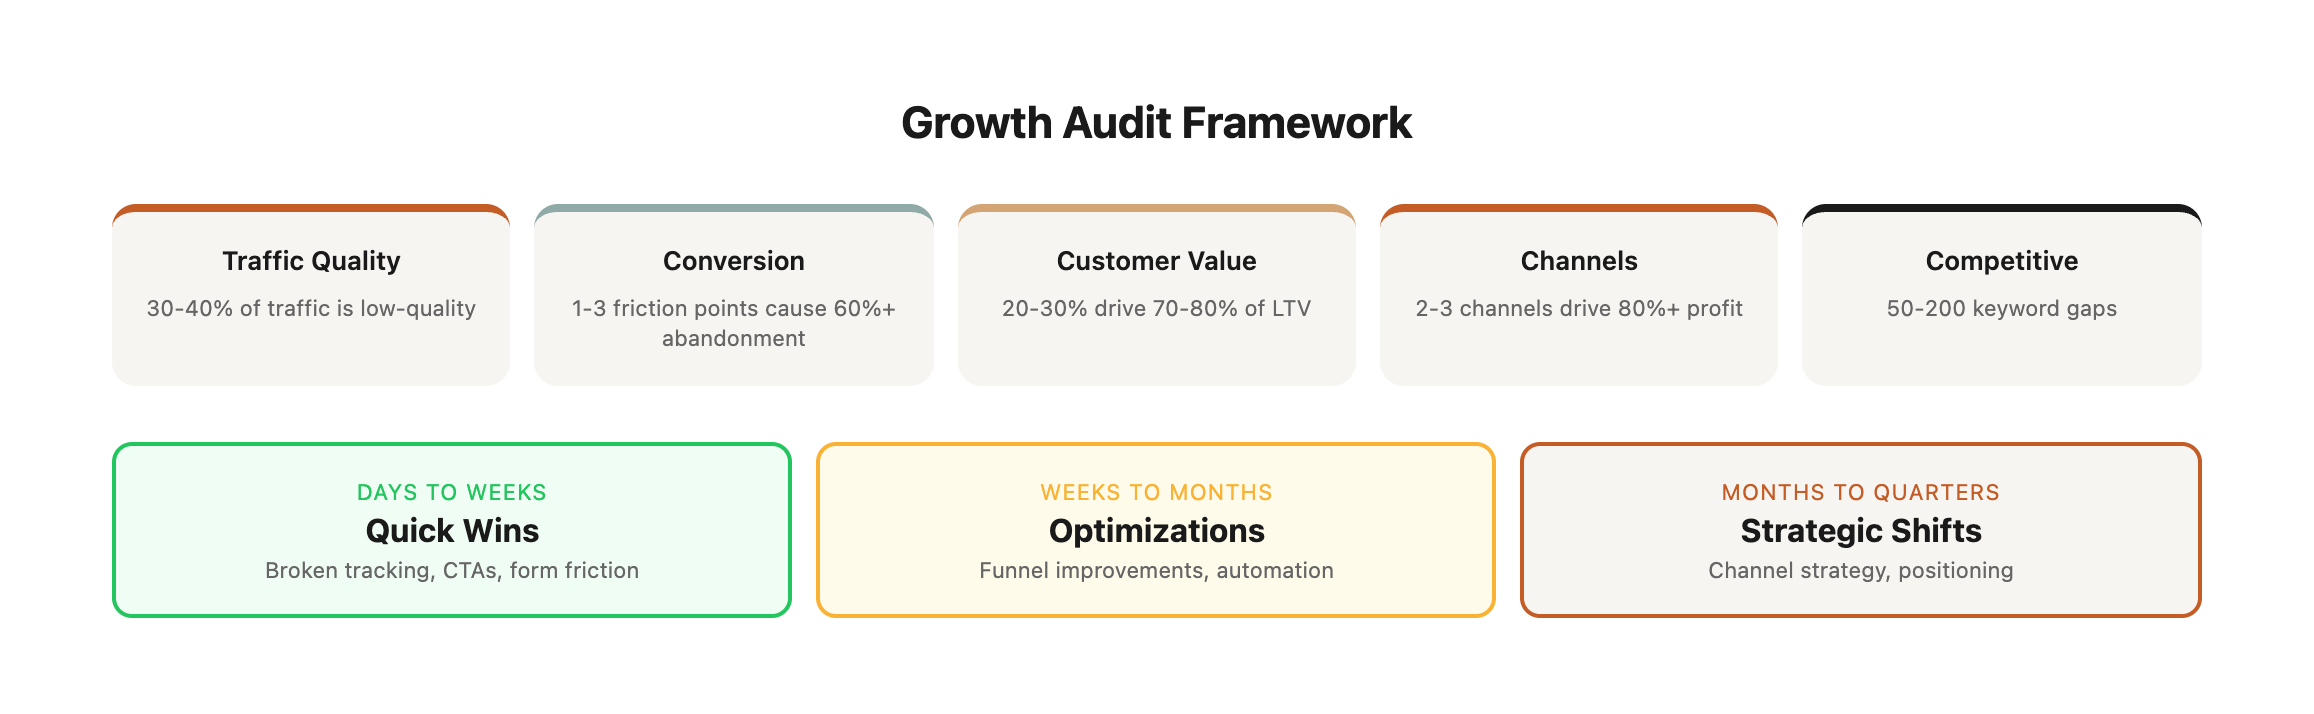
The Five Core Areas of Analysis
The audit covers five key areas:
Why Traditional Analytics Fall Short
Most businesses look at dashboards that show what happened, but they don't reveal why it happened or what to do about it. Here's the difference:
Standard Analytics: "Conversion rate dropped from 2.8% to 2.3% last month."
Growth Audit Insight: "Conversion rate dropped because you launched a new Facebook campaign that increased traffic by 40%, but that traffic has a 68% bounce rate and 0.7% conversion rate—significantly below your site average of 2.8%. The campaign is profitable at a 0.8:1 LTV:CAC ratio, meaning you're losing $0.20 for every dollar spent. Recommendation: Pause campaign, analyze audience targeting, test different creative approaches on a smaller budget."
The audit answers three questions your dashboard can't:
- What's the root cause? Not just what changed, but why it changed.
- What's the opportunity cost? What revenue are you leaving on the table?
- What's the priority? Which fixes deliver the most impact for the least effort?
The Three Layers of Hidden Opportunity
Through our audits, we've found that opportunities typically exist at three levels. Understanding which layer you're operating in determines your timeline and resource allocation.
1. Quick Wins (Days to Weeks)
These are the low-hanging fruit - problems that can be fixed quickly with immediate impact. Quick wins typically require minimal development resources and can be implemented by marketing teams directly.
Real Case Study: The 40% Invisible Revenue
A $3.2M annual revenue e-commerce client came to us frustrated that their marketing "wasn't working." Traffic was up, but conversions seemed flat.
Within 48 hours of starting the audit, we discovered their Google Analytics 4 wasn't firing properly on the confirmation page. They were only tracking about 60% of actual conversions.
The fix took 3 hours. Their actual conversion rate was 3.8%, not the 2.3% they thought. This completely changed their understanding of channel performance:
- Before: Paid search appeared to have 1.8% conversion rate (unprofitable)
- After: Paid search actually had 3.2% conversion rate (highly profitable)
- Result: They tripled their paid search budget and grew revenue by $420k in the next quarter
This is why we always start with data integrity. If your measurement is broken, every decision you make is based on fiction.
Quick Win Identification Checklist
Run through these in your first audit session:
[ ] Is tracking firing on all conversion pages? (Check with Tag Assistant)
[ ] Are form fields necessary? (Each field reduces completion by 5-10%)
[ ] Do high-traffic pages have clear, specific CTAs? (Avoid "Learn More")
[ ] Are you retargeting cart abandoners? (Should have 3-5 email sequence)
[ ] Are you bidding on brand terms? (Highest ROI in paid search)
[ ] Do product/service pages answer key objections? (Price, implementation, support)
[ ] Is your site mobile-optimized? (60%+ of traffic is mobile)
[ ] Are load times under 3 seconds? (Every 1s delay = 7% conversion drop)
2. Strategic Gaps (Weeks to Months)
These are larger opportunities that require more effort but deliver substantial returns. Strategic gaps typically require cross-functional coordination and sustained execution over weeks or months.
Real Case Study: The $1.2M Content Gap
A B2B SaaS company ($8M ARR) was frustrated with their organic growth. They were publishing 2-3 blog posts per month but seeing minimal traffic increases.
Our audit revealed a massive content gap:
Competitive Content Analysis:
The Insight: They were writing about their product (top-of-funnel awareness), but competitors were ranking for high-intent keywords—specific use cases, integration guides, comparison pages, and implementation tutorials.
The Strategy:
- Identified 50 high-value keywords competitors ranked for (search volume 500-5,000, buyer intent)
- Created comprehensive guides targeting those keywords
- Built internal linking structure to boost page authority
- Optimized existing pages to capture long-tail variations
The Results (6 months):
- Organic traffic: +127% (12,500 → 28,400 sessions/month)
- Organic conversions: +156% (142 → 364 conversions/month)
- Incremental revenue from organic: $1.24M annual
- Cost: $45k (3 months of content production)
- ROI: 2,756%
The lesson: Most companies aren't producing enough content—they're producing the wrong content. High-volume, low-intent keywords feel good (traffic goes up) but don't drive business outcomes.
Strategic Gap Analysis Framework:
Use this process to identify strategic gaps:
1. Customer Journey Mapping
   ├─ Awareness: How do prospects first learn about you?
   ├─ Consideration: What content helps them evaluate you vs. competitors?
   ├─ Decision: What removes final objections before purchase?
   └─ Retention: What keeps customers engaged and expanding?

2. Content Inventory Audit
   ├─ Map existing content to journey stages
   ├─ Identify stages with <3 pieces of content
   ├─ Compare to competitors' content footprint
   └─ Prioritize gaps with highest search volume + buyer intent

3. Audience Segmentation Analysis
   ├─ Who are your best customers? (highest LTV, lowest CAC)
   ├─ What segments are you ignoring?
   ├─ What's the TAM of underserved segments?
   └─ What messaging would resonate with them?

4. Channel Expansion Opportunities
   ├─ Where do competitors have presence you don't?
   ├─ What channels have you never tested?
   ├─ What's the minimum viable test budget?
   └─ What's the expected payback period?
3. Systemic Issues (Months to Years)
These are foundational problems that, when addressed, create lasting competitive advantage. Systemic issues require executive buy-in, significant investment, and organizational change management.
Real Case Study: The Positioning Crisis
A professional services firm ($12M revenue) had a systemic issue they couldn't see: their positioning made them invisible.
The Problem:
- Website headline: "We help businesses grow"
- Service description: "Marketing strategy, content marketing, paid advertising, SEO"
- Target market: "B2B and B2C companies looking to scale"
This is what we call "positioning by platitude"—true but meaningless. They sounded like every other agency.
The Audit Revealed:
Their best clients (highest LTV, lowest churn, most referrals) had three things in common:
- Manufacturing companies ($10M-$100M revenue)
- Needed to shift from trade shows to digital (COVID accelerated this)
- Had products too technical for traditional marketers to understand
The Insight: They weren't a generalist marketing agency—they were manufacturing marketing specialists who understood complex B2B buying cycles.
The Transformation:
The Results (18 months):
- Average deal size: +187% ($5,200 → $14,900/month)
- Sales cycle: -40% (8.2 months → 4.9 months)
- Close rate: +143% (12% → 29%)
- Annual revenue: +156% ($12M → $30.7M)
- Referral rate: +220% (became the obvious choice in their niche)
The ROI: The repositioning cost $85k (market research, messaging development, website rebuild, content overhaul). First-year incremental revenue: $18.7M.
Systemic Issue Identification Framework:
These issues are harder to spot because they feel like "that's just how things are." Use these diagnostic questions:
Brand Positioning Diagnostics:
├─ Can a 10-year-old explain what you do and who you serve?
├─ Do prospects say "we need to think about it" more than 40% of the time?
├─ Are you losing deals to competitors on price?
├─ Is your close rate below industry average (10-25% for most B2B)?
└─ Do customers struggle to explain what you do to others?

Technology Stack Diagnostics:
├─ Does your team spend >20% of time on manual tasks?
├─ Do systems not talk to each other (spreadsheet exports between tools)?
├─ Can you track a customer from first touch to revenue?
├─ Does reporting take >4 hours per week?
└─ Are you limited by tool capabilities vs. strategy?

Organizational Alignment Diagnostics:
├─ Do sales and marketing have different definitions of a "qualified lead"?
├─ Does product roadmap align with market demand?
├─ Is marketing measured on leads while sales is measured on revenue?
├─ Do teams have conflicting priorities or goals?
└─ Is data siloed across departments?

Market Position Diagnostics:
├─ Are you competing on price vs. value?
├─ Do you serve everyone or have a clear ICP?
├─ Can you name your top 3 competitors instantly?
├─ Do you own a category or subcategory?
└─ Would customers be confused if you disappeared tomorrow?
Warning Signs You Have Systemic Issues:
You're working harder but results plateau. You're doing "all the right things" but growth is incremental at best. You're winning deals but struggling with commoditization and price pressure. Your team is busy but not productive.
These aren't symptoms of poor execution—they're symptoms of foundational problems that tactical fixes can't solve.
The Growth Audit Framework
This is the exact five-step process we use with clients. You can run this yourself or use it to evaluate vendors who claim to do "growth audits."
The entire process takes 2-4 weeks depending on data availability and business complexity. Here's what each step entails and what you should expect to discover.
Step 1: Data Collection (Week 1)
Before you can find opportunities, you need clean, comprehensive data. Garbage in, garbage out.
Gather the following metrics from the past 90 days (minimum—12 months is ideal for trend analysis):
Data Collection Checklist:
Before moving to analysis, verify you have:
[ ] 90+ days of traffic data by source/medium (12 months preferred)
[ ] Conversion events properly tracked in GA4
[ ] Ad spend data matched to conversions (attribution modeling)
[ ] Customer revenue data by acquisition source
[ ] Funnel drop-off data for each stage
[ ] Competitor benchmark data (SimilarWeb, Ahrefs, SEMrush)
[ ] Customer feedback/survey data (qualitative insights)
[ ] Sales team input on lead quality by source
Common Data Collection Pitfalls:
- Incomplete attribution: Conversions tracked but not connected to acquisition source
- Missing offline conversions: Phone calls, in-store purchases, sales team deals not in analytics
- Inconsistent date ranges: Comparing December to July (seasonal businesses)
- Ignoring micro-conversions: Only tracking purchases, not newsletter signups, demo requests, etc.
- No qualitative data: Numbers tell you what happened, not why it happened
Step 2: Traffic Quality Analysis (Week 1-2)
Most companies optimize for traffic volume. That's wrong. Traffic quality matters more than quantity. A channel with 1,000 visitors and 4% conversion rate ($40 conversions) is worth 4x more than a channel with 10,000 visitors and 0.4% conversion rate (also 40 conversions) because CAC is lower.
Build this diagnostic table for your business:
Traffic Quality Scoring Matrix:
Use this framework to grade each channel (1-10 scale, 10 is best):
Analysis Questions to Ask:
-
High Traffic, Poor Engagement (Paid Social in example)
- Is ad targeting too broad? (Targeting "interested in business" vs. "searched for [specific product]")
- Is creative misaligned with landing page? (Ad promises one thing, page delivers another)
- Is this the wrong platform for your audience? (LinkedIn for B2C consumer products)
- Are you attracting browsers vs. buyers? (Content offers vs. product-focused ads)
-
Low Volume, Excellent Economics (Email, Referral in example)
- Opportunity: These channels are starved for investment.
- Email: Increase list growth budget, test send frequency, segment more aggressively
- Referral: Launch formal referral program with incentives
-
Overinvestment vs. ROI (Paid Social spending $12,750 for 2.3:1 LTV:CAC)
- Action: Reduce spend by 50-75%, reallocate to higher-performing channels
- Test: If you cut budget in half, does performance improve? (Often yes—you're excluding lowest-quality audience segments)
-
Budget Reallocation Opportunity
- Current spend: 27% to Paid Social (worst performer)
- Optimal spend: Shift 60% of that budget to Email/Referral expansion
- Expected impact: 25-40% increase in total conversions with same budget
The Traffic Quality Diagnostic Questions:
Run through these for each major channel:
For Each Traffic Source, Ask:

Audience Fit:
├─ Are bounce rates >20% higher than site average? (Wrong audience)
├─ Is time on site <50% of site average? (Misleading messaging)
├─ Are pages per session <2.0? (Not engaging with content)
└─ Is conversion rate <50% of site average? (Poor qualification)

Economics:
├─ Is LTV:CAC ratio below 3:1? (Unprofitable)
├─ Is payback period >12 months? (Cash flow risk)
├─ Is CAC trending up month-over-month? (Audience saturation)
└─ Are you profitable on a contribution margin basis? (Real profitability)

Scalability:
├─ Does increased spend improve or worsen efficiency? (Saturation testing)
├─ Is there additional audience to target? (Market size)
├─ Can you improve creative/targeting to expand reach? (Optimization runway)
└─ Is there seasonality impacting performance? (Timing factors)
Real Example: The Paid Social Trap
A B2C e-commerce brand was spending $45k/month on Facebook and Instagram ads. Traffic was great (85,000 sessions/month) but conversion rate was terrible (0.6% vs. 2.8% site average).
The Discovery:
- 72% of paid social traffic bounced within 10 seconds
- Average order value from paid social: $42 vs. $87 site average
- LTV:CAC ratio: 1.2:1 (losing money on every customer)
The Root Cause:
- Ads were optimized for clicks (CPM bidding)
- Creative emphasized "free shipping" and "sale" (attracting discount seekers)
- No post-purchase sequence to increase AOV
- Serving ads to anyone who clicked, not purchase intent signals
The Fix:
- Reduced budget by 60% ($45k → $18k/month)
- Shifted to conversion-focused bidding (optimize for purchase, not click)
- Changed creative to emphasize product quality, not discounts
- Implemented 30-day nurture sequence for first-time buyers
- Added upsell sequence post-purchase
The Result:
- Traffic decreased 58% (85,000 → 35,700 sessions)
- Conversion rate increased 283% (0.6% → 2.3%)
- AOV increased 52% ($42 → $64)
- LTV:CAC improved to 4.8:1 (now profitable)
- Net effect: $27k less spend, $34k more profit
Less traffic, more revenue. That's the power of quality over quantity.
Step 3: Conversion Funnel Mapping (Week 2)
Your conversion funnel reveals where prospects leak out of your customer journey. Most businesses lose 95-98% of visitors. The question is: where are you losing them, and why?
The Complete Funnel Analysis:
What This Table Reveals:
Three critical failure points emerge:
- Engagement (44% bounce): Almost half of visitors leave within 30 seconds
- Cart/Form Initiation (70% drop-off): Major friction before commitment
- Checkout/Submit (50% abandon): Losing half of qualified buyers
Friction Point Analysis:
For each major drop-off point, investigate root causes:
Opportunity Sizing Methodology:
Let's calculate the revenue impact of fixing each friction point:
Scenario 1: Fix Checkout Abandonment (Highest Impact, Fastest Implementation)
Current state:
- 1,875 reach checkout
- 50% abandon (937 lost)
- 1,125 complete (60% of those who start)
Target state (industry average 30% abandonment):
- 1,875 reach checkout
- 30% abandon (562 lost)
- 1,312 complete (70% of those who start)
Impact:
- Incremental conversions: 187 per month
- At $150 average order value = $28,050 monthly
- Annual opportunity: $336,600
- Implementation time: 1-2 weeks
- Investment required: $5k-$15k (payment optimization, trust signals, UX improvements)
- ROI: 2,244% to 6,732%
Scenario 2: Fix Cart Abandonment (Medium Impact, Medium Effort)
Current state:
- 3,750 add to cart
- 50% abandon before checkout (1,875 lost)
Target state (reduce to 35% abandonment):
- 3,750 add to cart
- 35% abandon (1,312 lost)
- 2,437 reach checkout (vs. current 1,875)
Impact:
- +562 additional checkout starts
- At current 60% completion rate = 337 additional conversions
- At $150 AOV = $50,550 monthly
- Annual opportunity: $606,600
- Implementation time: 2-4 weeks
- Investment required: $15k-$35k (form simplification, trust building, objection handling)
- ROI: 1,733% to 4,044%
Scenario 3: Fix Both (Compound Effect)
If you fix both friction points, the impact compounds:
- Start: 3,750 add to cart
- Reduced cart abandonment (35%): 2,437 reach checkout
- Reduced checkout abandonment (30%): 1,706 complete purchase
Impact:
- Current conversions: 1,125
- Optimized conversions: 1,706
- Increase: +581 conversions (+52%)
- Monthly revenue increase: $87,150
- Annual opportunity: $1,045,800
That's a $1M+ annual opportunity by fixing two friction points.
Funnel Conversion Diagnostic Framework:
Use this checklist for each funnel stage:
Landing Page (Goal: 60-70% engagement rate)
├─ Page loads in <3 seconds? (Speed is conversion)
├─ Headline immediately communicates value? (5-second test)
├─ Hero image/video reinforces message? (Visual clarity)
├─ Clear primary CTA above fold? (Single action)
├─ Mobile experience equals desktop? (60% are mobile)
└─ Tracking accurately captures engagement? (Data integrity)

Product/Service Pages (Goal: 35-45% cart initiation)
├─ Value proposition clear in first screen? (Why buy from you)
├─ Price and shipping costs transparent? (No surprises)
├─ Social proof visible? (Reviews, testimonials, trust badges)
├─ FAQs address top objections? (Remove doubt)
├─ Multiple CTAs throughout page? (Low friction to act)
├─ Image/video quality professional? (Perceived value)
└─ Mobile experience optimized? (Thumb-friendly CTAs)

Cart/Form (Goal: 60-70% checkout initiation)
├─ Form fields minimized? (Each field = 5-10% drop)
├─ Guest checkout available? (No forced account creation)
├─ Progress indicator shown? (Know what to expect)
├─ Easy to edit cart? (Reduce friction)
├─ Security badges visible? (Build trust)
├─ Shipping cost calculator available? (Transparency)
└─ Save cart option offered? (Return intent)

Checkout/Submit (Goal: 70-80% completion)
├─ One-page checkout? (Fewer steps = higher conversion)
├─ Multiple payment options? (Credit, PayPal, Apple Pay, etc.)
├─ Auto-fill enabled? (Speed matters)
├─ Errors clearly explained? (User-friendly validation)
├─ SSL/security indicators prominent? (Trust signals)
├─ Exit-intent offer triggered? (Last chance to save)
└─ Order confirmation immediate? (Reduce anxiety)
Real Case Study: The $840k Checkout Fix
A SaaS company with a $299/month product had a 42% checkout abandonment rate. Industry standard for SaaS is 20-25%.
The Audit Discovery:
We recorded 100 checkout sessions. Patterns emerged:
- 58% of abandoners clicked the "What happens after I subscribe?" link (uncertainty)
- 34% of abandoners toggled between annual and monthly pricing 3+ times (decision paralysis)
- 28% of abandoners entered credit card info then closed tab (commitment anxiety)
- 19% of abandoners tried a promo code, got "invalid" error, left (deal-seeking)
The Fixes (in order of implementation):
-
Week 1: Added "What happens next" explainer directly on checkout page (no click required)
- Result: Abandonment dropped to 38% (-4 pts)
-
Week 2: Added side-by-side annual vs. monthly savings calculator
- Result: Abandonment dropped to 34% (-4 pts)
-
Week 3: Added money-back guarantee banner with "Cancel anytime, get full refund" language
- Result: Abandonment dropped to 28% (-6 pts)
-
Week 4: Created intelligent promo code system (auto-applies best available discount, no code needed)
- Result: Abandonment dropped to 23% (-5 pts)
Total Impact:
- Abandonment: 42% → 23% (-45% relative improvement)
- Completion rate: 58% → 77% (+33% relative improvement)
- Monthly new customer conversions: +63 customers
- At $299/month with 18-month average LTV: +$63 × $5,382 (LTV) = $339,066/month
- Annual incremental revenue: $4,068,792
- Investment: $28,000 (UX research, design, development)
- ROI: 14,531%
The lesson: Small friction creates massive revenue loss. Remove friction, unlock growth.
Step 4: Channel Performance Deep Dive (Week 2-3)
Most companies measure channel performance by cost per click or conversion rate. That's insufficient. True channel performance requires understanding full customer economics over time.
Calculate true ROI by channel using this comprehensive framework:
Key Metrics Explained:
- CAC (Customer Acquisition Cost): Total channel spend ÷ new customers acquired
- LTV (Lifetime Value): Average revenue per customer over their lifetime
- LTV:CAC Ratio: The holy grail metric—higher is better
- Below 3:1 = Unsustainable (you're spending too much to acquire)
- 3:1 to 5:1 = Healthy (sustainable growth)
- Above 5:1 = Excellent (underinvesting—should scale)
- Payback Period: How long until you recover CAC from customer revenue
- < 3 months = Excellent (scale with confidence)
- 3-6 months = Good (scale with monitoring)
- 6-12 months = Acceptable (requires cash reserves)
-
12 months = Risky (cash flow pressure)
- Contribution Margin: (Conversions × LTV) - Channel Spend = Actual profit generated
Channel Performance Grading System:
Use this matrix to grade each channel:
Strategic Decisions Based on Data:
-
Email Marketing & Content (A+ Channels)
- Current: Spending $7k/month, generating $195k contribution margin
- Opportunity: These channels are starved for investment
- Action: Increase email list growth budget from $2k to $8k/month
- Action: Increase content production from $5k to $15k/month
- Expected Impact: If efficiency stays constant, contribution margin increases to $558k/month
- Reality Check: Efficiency typically decreases 20-30% with scale, but still excellent returns
-
Facebook Ads (D Channel)
- Current: Spending $18k/month, generating $24k contribution margin (1.33x return)
- Problem: Long payback period (8.4 months) creates cash flow pressure
- Problem: Low LTV ($280) suggests poor customer quality or high churn
- Action: Reduce spend by 50% ($18k → $9k)
- Action: Test conversion-focused bidding vs. traffic-focused
- Action: Implement 60-day nurture sequence to increase LTV
- Expected Impact: Lower volume, higher quality, better economics
-
LinkedIn Ads (B Channel)
- Current: Spending $8k/month, solid economics (3.4:1 LTV:CAC)
- Opportunity: Low volume but good efficiency suggests room to scale
- Risk: B2B platforms often saturate quickly
- Action: Increase spend by 25% ($8k → $10k) and monitor efficiency
- Action: If CAC stays below $220, continue scaling
- Test: If CAC exceeds $250, hold at current budget
-
Google Search (A Channel)
- Current: Strong performer, highest absolute contribution
- Action: Maintain spend, optimize for efficiency gains
- Focus: Improve quality score, expand keyword targeting, test PMAX
The Channel Reallocation Exercise:
Current monthly budget allocation:
Optimized budget allocation (same $51,500 budget):
Impact of Reallocation:
- Same budget: $51,500
- Current contribution margin: $414,770
- Optimized contribution margin: $976,068
- Improvement: +135% (+$561,298/month)
- Annual impact: $6,735,576
This is why channel performance analysis matters. You can double your marketing efficiency without spending another dollar—just spend it better.
Channel Performance Diagnostic Questions:
For Each Channel, Evaluate:

Profitability:
├─ Is LTV:CAC above 3:1? (Minimum viability threshold)
├─ Is payback period under 12 months? (Cash flow sustainability)
├─ Are you profitable on a contribution margin basis? (True economics)
└─ Is ROI improving or declining month-over-month? (Trend analysis)

Scalability:
├─ Does increased spend improve or worsen CAC? (Efficiency at scale)
├─ Is there audience saturation? (Frequency analysis, diminishing returns)
├─ Can you expand targeting without sacrificing quality? (Addressable market)
└─ Are competitors bidding up costs? (Competitive pressure)

Strategic Fit:
├─ Does channel attract your ideal customer profile? (Audience quality)
├─ Does channel align with your brand positioning? (Strategic alignment)
├─ Does channel create compounding value? (Content, owned audience)
└─ Can you sustain advantage in this channel? (Competitive moat)
Step 5: Competitive Gap Analysis (Week 3-4)
You don't compete in a vacuum. Your competitors are fighting for the same customers, the same rankings, the same attention. Competitive gap analysis reveals where you're losing market share and why.
The Complete Competitive Landscape:
*Lower priority because these are inputs (budget, team size) not outputs—focus on efficiency with current resources first.
Competitive Position Analysis:
Your Market Position Assessment:

Strengths (Top 2 in category):
├─ Review rating (4.2 - competitive with established players)
├─ Pricing flexibility (mid-market allows up-market and down-market plays)
└─ Newer brand (less legacy tech debt, can move faster)

Competitive Gaps (Bottom 2 in category):
├─ SEO footprint (10-20x behind on keywords, content, authority)
├─ Social proof volume (10-15x behind on review count)
├─ Email audience size (5-7x behind on list size)
└─ Paid advertising presence (2-4x behind on impression share)

Critical Vulnerabilities (>80% behind leader):
├─ Organic search visibility (-90% keyword rankings)
├─ Link profile strength (-90% referring domains)
├─ Review generation rate (-93% review growth)
└─ Content production (-80% publishing rate)
Gap Prioritization Matrix:
Not all gaps matter equally. Prioritize based on impact, competitive dynamics, and resource requirements.
The Competitive Threat Assessment:
For each major competitor, understand their strategic advantage:
Competitive Intelligence Sources:
Gather competitive data from these sources:
SEO & Content Intelligence:
├─ Ahrefs/SEMrush (keyword rankings, backlink profiles, content gaps)
├─ SimilarWeb (traffic estimates, traffic sources, audience overlap)
├─ Google Search (manual SERP analysis for target keywords)
└─ Screaming Frog (site structure, technical SEO analysis)

Ad Intelligence:
├─ Facebook Ad Library (active ad creative, messaging themes)
├─ Google Ads Auction Insights (impression share, overlap rate)
├─ SpyFu/iSpionage (keyword bidding, ad copy, landing pages)
└─ AdClarity/Pathmatics (display ad spend estimates)

Social Proof Intelligence:
├─ G2/Capterra/TrustPilot (review volume, sentiment, themes)
├─ Trustpilot API (review growth rate, response rate, ratings distribution)
├─ Yelp (local business reviews, photos, engagement)
└─ Better Business Bureau (complaints, resolution rate, accreditation)

Audience Intelligence:
├─ LinkedIn (company size, growth rate, employee titles)
├─ BuiltWith (technology stack, integrations, migrations)
├─ Hunter.io (email formats, key contacts, org structure)
└─ Owler (funding, revenue estimates, news mentions)
Real Case Study: Closing a 10x Content Gap
A fintech startup was competing against established players with 10x more content, 10x more domain authority, and 10x more organic traffic.
The Competitive Reality:
- Competitor A: 2,400 ranking keywords, DR 58, 85k monthly organic traffic
- Competitor B: 1,800 ranking keywords, DR 51, 62k monthly organic traffic
- Our client: 240 ranking keywords, DR 23, 6k monthly organic traffic
Traditional advice: "Just publish more content." That would take 5+ years to catch up.
Our Strategy:
Instead of competing where they were strong, we found gaps where they were weak:
- Keyword Gap Analysis: Identified 150 high-value keywords (1k-10k volume) where NO competitor ranked in top 10
- Content Depth Strategy: Published 50 comprehensive guides (3,000-5,000 words) vs. competitors' thin content (800-1,200 words)
- User Experience Focus: Built interactive calculators, comparison tools, and data visualizations (competitors had static text)
- Strategic Link Building: Targeted 20 high-authority publications with original research (competitors did generic outreach)
The Results (12 months):
- Ranking keywords: 240 → 1,340 (+458%)
- Organic traffic: 6k → 48k/month (+700%)
- Domain authority: 23 → 39 (+70%)
- Market position: 4th → 2nd in target keyword segment
- Revenue impact: $18M ARR (up from $4M)
The Insight: Don't try to beat competitors at their own game. Find where they're vulnerable and dominate there first.
Priority Matrix:
Use this framework to prioritize opportunities:
The 30-60-90 Day Action Plan:
Days 1-30 (Quick Wins):
- Implement cart abandonment email sequence
- A/B test product page headlines and CTAs
- Launch customer review request campaign
- Reallocate 50% of Facebook budget to email/content
Expected Impact: +15-20% conversion rate, +$40k monthly revenue
Days 31-60 (Strategic Improvements):
- Audit and refresh top 20 landing pages
- Launch content calendar targeting keyword gaps
- Implement lead magnet strategy for email growth
- Test new ad creative concepts on LinkedIn
Expected Impact: +25% qualified traffic, +10% conversion rate
Days 61-90 (Foundation Building):
- Launch link building outreach campaign
- Implement customer referral program
- Build marketing attribution dashboard
- Develop quarterly testing roadmap
Expected Impact: Long-term sustainable growth engine
What a Good Audit Reveals
Here's what we typically find in a growth audit:
- 3-5 quick wins that can be implemented immediately
- 2-3 strategic priorities for the next quarter
- 1-2 systemic issues that need longer-term attention
- A clear prioritization based on impact and effort
Most importantly, a good audit gives you confidence. Instead of guessing what might work, you're making decisions based on data. Instead of trying everything, you're focusing on what matters.
Ready to Find Your Hidden Opportunities?
Every business has growth opportunities waiting to be discovered. The question is whether you'll find them before your competitors do.
Need a comprehensive growth roadmap? Explore our Growth Strategy services for fractional CMO support and strategic planning that uncovers and prioritizes your biggest opportunities.
If you'd like to discuss what a growth audit could reveal for your business, let's talk. We'll start with a conversation about your goals and challenges, and determine if an audit makes sense for your situation.