
Modern marketing generates an overwhelming amount of data. Dashboards overflow with impressions, clicks, followers, open rates, engagement scores, and dozens of other metrics. But here's the uncomfortable truth: most of these numbers don't matter.
The metrics that fill your reports often have little connection to business outcomes. They feel good to track—who doesn't want to see follower counts rise?—but they don't help you make better decisions or drive real growth. It's time to cut through the noise.
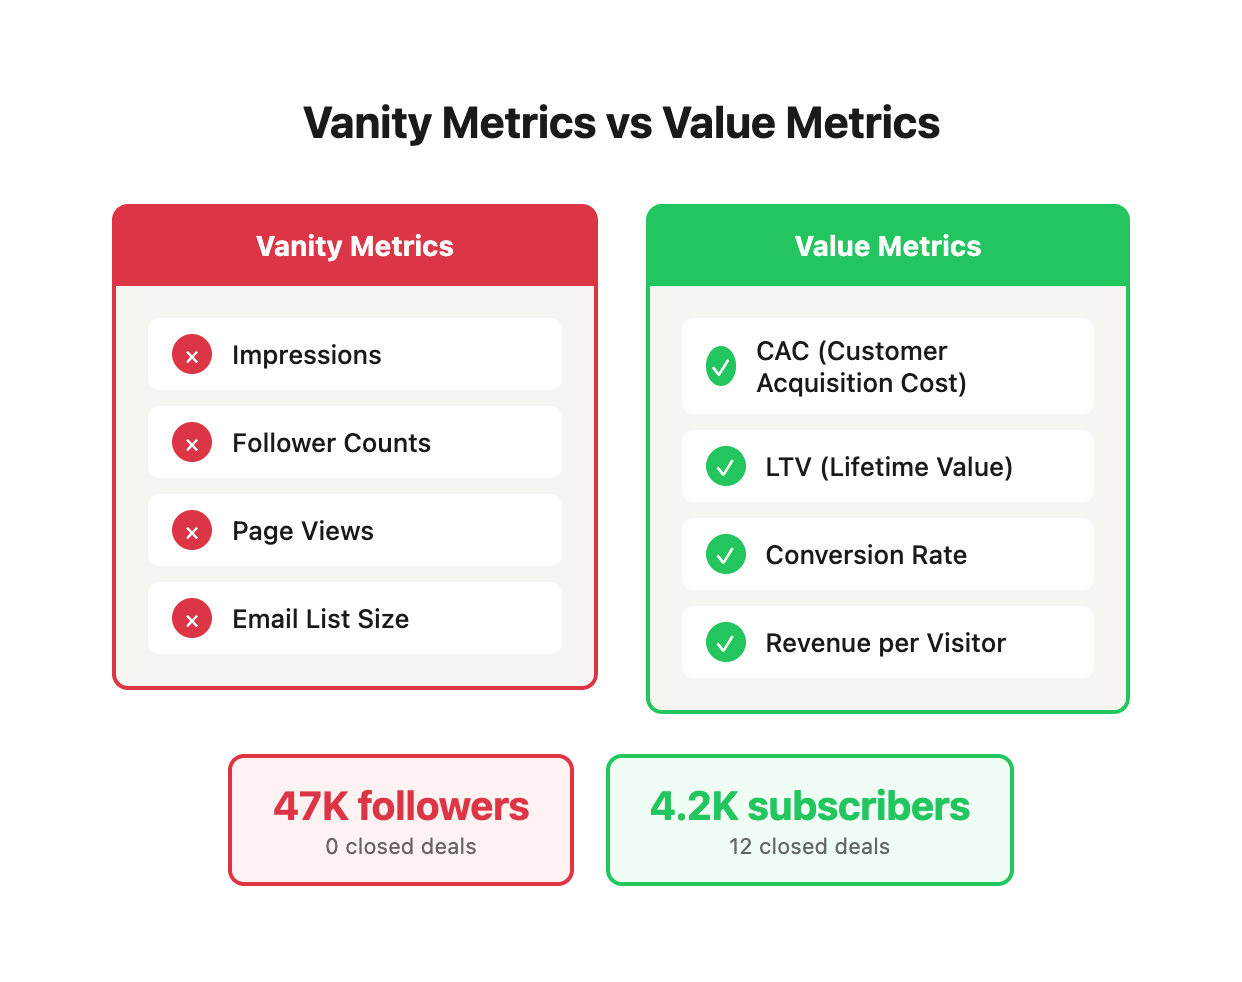
The Vanity Metrics Trap
Vanity metrics are numbers that look impressive but don't connect to business value. They create what we call "metric theater"—the performance of measurement without the substance of insight. Common examples:
- Impressions: How many times something was shown, regardless of engagement.
- Follower counts: A big number that may or may not translate to reach or revenue.
- Page views: Traffic without context about quality or intent.
- Email list size: Subscribers who may never open, click, or buy.
These metrics share a common problem: they measure activity, not outcomes. They tell you what happened, but not whether it mattered.
"The most dangerous metrics are the ones that make you feel good about bad performance. If you're celebrating vanity metrics while revenue declines, you're missing the point."
Real-World Example: The Social Media Illusion
A B2B software company we worked with had grown their LinkedIn following to 47,000 people over three years. Leadership celebrated this milestone in quarterly meetings. But when we analyzed the business impact, the story changed dramatically:
Meanwhile, their email list of just 4,200 subscribers generated 89 demo requests and 12 closed deals in the same quarter. The company was celebrating the wrong metric while neglecting the channel that actually drove revenue.
The Psychology Behind Vanity Metrics
Why do organizations fall into this trap? Several factors:
- Social proof bias: Large numbers feel impressive and are easy to communicate to leadership
- Effort justification: If you invested time growing something, you want to believe it matters
- Delayed feedback loops: Vanity metrics respond quickly; revenue metrics take longer
- Competitive comparison: It's easier to benchmark follower counts than business outcomes
The solution isn't to ignore awareness metrics entirely—it's to tie them to downstream business value or stop tracking them altogether.
Metrics That Actually Matter
The metrics worth tracking have these characteristics:
- They connect directly to revenue or profitability
- They can be acted upon—when they move, you know what to do
- They're leading indicators of future performance
- They help you allocate resources more effectively
Here are the metrics we focus on with clients:
Customer Acquisition Cost (CAC)
What it costs to acquire a new customer, fully loaded. This is the foundation of sustainable growth. If your CAC exceeds what a customer is worth, you're losing money with every sale.
How to Calculate CAC Correctly:
Most companies underestimate CAC by excluding key costs. Here's the complete picture:
CAC Calculation Example:
Month: October 2025
Total Ad Spend: $45,000
Marketing Salaries: $28,000
Sales Salaries: $52,000
Marketing Software: $4,200
Content Production: $8,500
Overhead Allocation (25% of dept costs): $21,425

Total Marketing & Sales Cost: $159,125
New Customers Acquired: 487

Simple CAC = $159,125 / 487 = $326.75
How to use it: Track CAC by channel, campaign, and customer segment. Identify where you're acquiring customers efficiently and where you're overspending.
Channel-Level CAC Analysis:
Key Insights from This Data:
- Email has 13.6x better efficiency than blended average - but it depends on list quality from other channels
- Facebook is at break-even efficiency - needs optimization or budget reallocation
- Direct channel CAC ($122) is 2.7x lower than fully loaded CAC ($327) - this gap is where most companies deceive themselves about profitability
Customer Lifetime Value (LTV)
The total revenue a customer generates over their relationship with you. This determines how much you can afford to spend on acquisition and where to focus retention efforts.
Advanced LTV Calculation:
The simple formula (AOV × Purchase Frequency × Lifetime) understates reality. Here's the complete model:
LTV = Σ(Revenue_t × Retention_Rate_t × Gross_Margin_t) / (1 + Discount_Rate)^t

Where:
- t = each time period (month/quarter)
- Retention_Rate_t = % of customers still active in period t
- Gross_Margin_t = revenue minus variable costs in period t
- Discount_Rate = time value of money (typically 10-15% annually)
Cohort-Based LTV Analysis (E-commerce Example):
What This Reveals:
- LTV is increasing over time - product/service improvements are working
- CAC is decreasing - marketing efficiency is improving
- More recent cohorts show 78% higher LTV than older cohorts (Jan 2023 vs Jan 2024)
- Economics improved dramatically - LTV:CAC went from 2.8:1 to 5.0:1 in 12 months
How to use it: Calculate LTV by acquisition source. You might find that organic search customers are worth 3x more than paid social customers—information that should inform your budget allocation.
LTV by Acquisition Channel (Real Client Data):
Action Plan from This Data:
- Organic search customers are 2.3x more valuable than Facebook customers - shift budget toward SEO
- Facebook has 38% retention vs 68% organic - either improve targeting or reduce spend
- Direct/returning traffic has highest LTV - invest in brand and retention marketing
- Email-sourced customers punch above their weight - grow the list aggressively
LTV:CAC Ratio
The relationship between what customers are worth and what they cost. Generally, you want this ratio to be at least 3:1. Below that, you're likely not profitable. Above 5:1, you're probably underinvesting in growth.
LTV:CAC Interpretation Framework:
How to use it: Monitor by channel and segment. A low ratio signals efficiency problems; a high ratio signals growth opportunities.
Real Case Study: SaaS Company Transformation:
Transformations Made:
- Improved onboarding: Reduced time-to-value from 28 days to 8 days → 34% churn reduction
- Better targeting: Focused on companies with 20-100 employees instead of 1-20 → higher LTV customers
- Content marketing: Organic drove 40% of new customers at $340 CAC vs $1,890 paid average
- Referral program: 23% of new customers came from referrals at $89 CAC
- Annual plans: 52% chose annual payment → improved cash flow and reduced CAC due to higher commitment
The company went from barely viable (1.7:1) to highly efficient (5.4:1) in 12 months, tripling growth rate.
Contribution Margin
Revenue minus variable costs, expressed as a percentage. This tells you how much money actually flows to the bottom line from each sale.
Full Contribution Margin Breakdown:
How to use it: Use contribution margin to prioritize which products, channels, or customers to focus on. High revenue with low contribution margin might be worse than moderate revenue with high margin.
Product-Level Contribution Analysis (E-commerce Client):
Strategic Decisions from This Data:
- Premium Gear has 79% higher margin than Budget - focus marketing here first
- Budget items can only support $22 CAC - but current blended CAC is $87 (unprofitable)
- Accessories have best margin % but low AOV - great for upsells but not acquisition offers
- Mid-range hits the sweet spot - balance of volume and margin
Action plan: Shift 60% of acquisition budget to Premium Gear. Use Budget and Accessories as loss leaders or bundled upsells only. This single change increased profitability by 34% in 90 days.
Conversion Rate by Stage
The percentage of people who move from one stage of your funnel to the next. This shows you where you're losing potential customers and where to focus optimization efforts.
How to use it: Build a funnel map with conversion rates at each stage. The biggest drop-offs are often your biggest opportunities.
Advanced Funnel Analysis Framework:
Complete Funnel with Benchmarks and Opportunity Analysis

Stage 1: AWARENESS
├─ Impressions: 2,450,000
├─ Clicks: 73,500 (3.0% CTR)
│  └─ Benchmark: 2.5-4.5% ✓ HEALTHY
└─ Cost: $0.61 per click

Stage 2: INTEREST
├─ Landing Page Visits: 68,245 (92.8% load success)
├─ Engaged Visitors: 42,391 (62.1% engagement)
│  └─ Benchmark: 60-70% ✓ HEALTHY
└─ Avg Time on Site: 2:47 (goal: 2:00+)

Stage 3: CONSIDERATION
├─ Product/Category Views: 13,148 (31.0% of engaged)
│  └─ Benchmark: 35-45% ⚠️ 11% BELOW TARGET
├─ Multiple Page Views: 9,834 (74.8% of viewers)
└─ Content Downloads: 2,847 (21.7% of viewers)

Stage 4: INTENT
├─ Add to Cart / Start Form: 2,894 (22.0% of viewers)
│  └─ Benchmark: 30-40% 🚨 27% BELOW TARGET
├─ Cart Value: $187 average
└─ Discount Code Applied: 34% (potentially too high)

Stage 5: PURCHASE
├─ Checkout Started: 1,679 (58.0% of carts)
│  └─ Benchmark: 70-80% 🚨 17% BELOW TARGET
├─ Checkout Completed: 789 (47.0% of checkouts)
│  └─ Benchmark: 70-80% 🚨 33% BELOW TARGET
└─ Revenue: $134,487

Overall Conversion: 1.16% (visitor to purchase)
Industry Benchmark: 2.0-3.0% 🚨 42% BELOW TARGET

⚠️ CRITICAL ISSUES IDENTIFIED:
1. Stage 3 (Consideration): 11% below benchmark
2. Stage 4 (Intent): 27% below benchmark
3. Stage 5 Purchase (Checkout Start): 17% below benchmark
4. Stage 5 Purchase (Completion): 33% below benchmark
Prioritized Optimization Roadmap:
Projected Impact of Fixes:
Revenue per Visitor (RPV)
Total revenue divided by total visitors. This combines traffic quality and conversion efficiency into a single number.
How to use it: Track RPV by traffic source. A source with lower traffic but higher RPV might deserve more investment than a high-traffic, low-RPV source.
RPV by Traffic Source (90-Day Analysis):
Key Insights:
- Branded search is 5.2x more valuable per visitor than Facebook Ads
- Email has nearly as much RPV as branded search - the list is gold
- Social organic delivers 91% lower RPV than average - should we quit posting?
- Display ads have marginal ROI - either dramatically improve or reallocate budget
Strategic Reallocation Plan:
By reallocating the same budget toward higher-RPV channels, this company projects 33% revenue increase with zero additional spend.
Payback Period
How long it takes to recoup customer acquisition cost. Even with a healthy LTV:CAC ratio, a long payback period can create cash flow problems.
How to use it: If payback is longer than you'd like, focus on strategies that accelerate early revenue—upsells, higher initial purchases, or faster time to first purchase.
Payback Period Scenarios:
Cash Flow Impact Visualization:
E-commerce Durable Goods (28.9 month payback):

Month 1:  -$156 (CAC spent)
Month 2:  -$151 (-$156 + $5 margin)
Month 3:  -$146 (-$156 + $10 margin)
Month 6:  -$126 (-$156 + $30 margin)
Month 12: -$91 (-$156 + $65 margin)
Month 24: -$26 (-$156 + $130 margin)
Month 29: $0 (BREAK EVEN) ← Almost 2.5 YEARS
Month 36: +$42 (finally profitable)

Problems:
- Need $156 upfront for every customer
- Takes 29 months to break even
- Any churn before month 29 = permanent loss
- Scaling requires massive cash reserves

SaaS Annual Upfront (1.1 month payback):

Month 1:  +$806 (-$890 CAC + $948 payment × 85% margin)
Month 2:  +$873 (+$806 + $67 month 2 payment)
Month 12: +$1,609 (cash flow positive from day 1)

Advantages:
- Break even in 5 weeks
- Can reinvest immediately
- Scaling doesn't require outside capital
- Cash reserves grow with customer base
Strategies to Improve Payback Period:
The Three-Tier Metrics Hierarchy
Build your metrics system in three layers:
Tier 1: North Star Metric (1 metric)
Your single most important business metric. Choose based on your business model:
How to Choose Your North Star:
Your North Star should be:
- Measurable: Clear definition, no ambiguity
- Actionable: Team can influence it through their work
- Leading: Predicts future business success
- Understandable: Everyone in company knows what it means
- Rate-based: Grows with successful execution
Example North Star Dashboard:
┌─────────────────────────────────────────┐
│  MONTHLY RECURRING REVENUE              │
│  ┌──────────────────────────────────┐  │
│  │  $487,250  ▲ 12.4% vs last month │  │
│  └──────────────────────────────────┘  │
│                                         │
│  YoY Growth: +47.2%                     │
│  Quarterly Target: $525,000 (93% of goal)│
│  Annual Target: $6,000,000 (On pace)   │
│                                         │
│  Trend: ████████████░░░░░░              │
│         Q1    Q2    Q3    Q4            │
└─────────────────────────────────────────┘
North Star Metric Decomposition:
Every North Star breaks down into component parts. Here's how to decompose MRR:
MRR = (# Customers) × (Average Revenue per Customer)

Which decomposes further into:

\# Customers = (Last Month Customers) + (New Customers) - (Churned Customers)
Avg Revenue = (New Customer MRR + Existing Customer MRR + Expansion MRR) / # Customers

Full equation:
MRR = [(Last Month Customers + New Customers - Churned Customers) ×
       (New MRR + Base MRR + Expansion MRR - Contraction MRR - Churned MRR)]

This reveals 5 levers to grow MRR:
1. Increase new customer acquisition
2. Decrease customer churn
3. Increase average deal size (new customer MRR)
4. Increase expansion revenue (upsells/cross-sells)
5. Decrease contraction (downgrades)
Tier 2: Leading Indicators (3-5 metrics)
Metrics that predict your North Star 30-60 days in advance:
Example Leading Indicators Dashboard:
┌─────────────────────────────────────────────────────────────┐
│  LEADING INDICATORS (30-Day Trend)                          │
├─────────────────────────────────────────────────────────────┤
│  New Customers        187  ▲ 8.1%   Target: 200            │
│  Churn Rate          2.8%  ▼ 0.3%   Target: <3%            │
│  Expansion MRR    $12,400  ▲ 15.2%  Target: $10,000        │
│  Avg Deal Size    $2,605   ▲ 3.8%   Target: $2,500         │
│  Pipeline Value   $1.2M    ▲ 22%    Target: $1M            │
│                                                              │
│  Forecast Impact on Next Month MRR:                         │
│  New Customer Impact:     +$47,000 (187 × $251 ARPU)       │
│  Churn Impact:            -$13,700 (2.8% × $487,250)        │
│  Expansion Impact:        +$12,400                          │
│  ───────────────────────────────────────────────────        │
│  Expected Net MRR Growth: +$45,700 (+9.4%)                  │
│  Expected Next Month MRR: $532,950                          │
└─────────────────────────────────────────────────────────────┘
Leading Indicator Warning Signals:
Create trigger points that demand immediate attention:
Tier 3: Diagnostic Metrics (10-15 metrics)
Channel and campaign-specific metrics for troubleshooting:
By Marketing Channel:
By Funnel Stage:
Example Diagnostic Dashboard:
CHANNEL HEALTH: Google Ads Search
─────────────────────────────────────────────
Account Quality Score:        7.8/10  ✓ Good
Impression Share:             73%     ✓ Healthy
Lost IS (Budget):             18%     ⚠️ Opportunity to scale
Lost IS (Rank):               9%      ✓ Competitive
Average Position:             2.1     ✓ Strong
CTR:                         6.2%     ✓ Above benchmark
Conversion Rate:             4.8%     ✓ Healthy
Cost per Conversion:         $156     ✓ Under target ($180)

⚠️ RECOMMENDATIONS:
1. Lost IS (Budget) at 18% - consider +25% budget increase
2. Quality score could improve to 8.5+ with landing page optimization
3. Position 2.1 is strong but could capture more volume at 1.5-1.8

📊 DIAGNOSTIC INSIGHT:
Account is healthy and efficient. Primary limitation is budget, not performance.
Increasing budget by 25% could add 23% more conversions at similar efficiency.
The Complete Marketing Metrics Dashboard
Here's how to structure your executive dashboard:
Section 1: Business Health (Top Level)
Executive Summary Narrative:
Business is performing strongly across all key metrics. Revenue growth accelerated to 12.4% month-over-month, driven by improved customer acquisition efficiency and better retention. CAC decreased 5.4% while LTV grew 3.2%, expanding the LTV:CAC ratio to a healthy 4.0:1. At current growth rates, we're on pace to exceed annual revenue target by 8%. Churn remains below 3%, indicating strong product-market fit. Payback period of 4.2 months enables aggressive scaling without cash flow constraints.
Section 2: Channel Performance
Channel Performance Insights:
- Top 3 performers (Email, SEO, Google Search) drive 72% of revenue with just 45% of spend
- Bottom 3 performers (Social, YouTube, Instagram) deliver just 4% of revenue with 12% of spend
- Facebook ROAS dropped 12% month-over-month - audience fatigue or increased competition
- Email continues to massively outperform - 66.3x ROAS suggests significant room to invest in list growth
Recommended Budget Reallocation:
Section 3: Funnel Health
Funnel Conversion Analysis (30 Days)

Landing Page Visits: 45,230
        ↓ 62% (Industry benchmark: 60-70%)
Engaged Visitors: 28,043
        ↓ 31% (Benchmark: 35-45%)
Product/Service Views: 8,693
        ↓ 28% (Benchmark: 30-40%)
Add to Cart / Lead Form Start: 2,434
        ↓ 58% (Benchmark: 60-70%) ⚠️ ATTENTION NEEDED
Checkout / Form Complete: 1,022
        ↓ 47% (Benchmark: 70-80%) ⚠️ CRITICAL ISSUE
Purchase Complete: 542
        ↓
Overall Conversion: 1.2% (Benchmark: 2-3%) ⚠️ BELOW TARGET

🚨 Priority Issues:
1. Cart/Form abandonment at 58% (should be 30-40%)
2. Checkout completion at 47% (should be 70%+)
3. Overall funnel conversion 40% below industry standard

💡 Hypothesis Testing Plan:
Week 1: A/B test checkout flow simplification (remove 2 steps)
Week 2: Test free shipping threshold ($75 vs $50 vs free always)
Week 3: Add trust badges and security seals to checkout
Week 4: Implement abandoned cart email sequence
Detailed Funnel Drop-off Analysis:
If all stages hit benchmark midpoint:
- Current: 542 purchases/month at $134,487 revenue
- Optimized: 1,024 purchases/month at $316,176 revenue
- Gain: +$181,689/month (+135% revenue increase)
Section 4: Customer Value Metrics
LTV Improvement Opportunities:
Combined Impact: If all high-priority initiatives succeed, LTV could increase from $624 to $867 (+39%), adding $538,100 in annual revenue.
Section 5: Early Warning Signals
Monitor these for trouble ahead:
Predictive Alert System:
⚠️ FORECASTED ISSUES (60-Day Projection)

Issue #1: Lead Quality Declining
├─ Current: 42% SQL rate
├─ Trend: -2% per month
├─ Projected: 38% in 60 days (below 40% threshold)
├─ Impact: -$24,000/month in wasted lead gen spend
└─ Recommended Action: Audit targeting criteria and qualification process

Issue #2: Demo No-Show Rate Rising
├─ Current: 28% no-show
├─ Trend: +3% per month
├─ Projected: 34% in 60 days (near 35% threshold)
├─ Impact: 18 lost demos/month = potential -$89,000 annual revenue
└─ Recommended Action: Implement SMS reminders and prep call 1 day before

✓ No other metrics projected to breach thresholds in next 90 days
Metric Calculation Formulas
Customer Acquisition Cost (CAC)
CAC = (Total Sales + Marketing Spend) / Number of New Customers

Example:
Sales & Marketing Spend = $58,400
New Customers = 477
CAC = $58,400 / 477 = $122.43

Fully Loaded CAC (includes all overhead):
= (Sales + Marketing + Overhead + Tools + Agency Fees) / New Customers
= ($58,400 + $12,000 + $3,200 + $4,800) / 477 = $164.41

What to Include in CAC:
✓ Advertising spend (all channels)
✓ Marketing salaries & benefits
✓ Sales salaries & commissions
✓ Marketing tools & software
✓ Agency & freelancer fees
✓ Content production costs
✓ Event & sponsorship costs
✓ Allocated overhead (25% of dept costs)

What NOT to Include:
✗ Product development costs
✗ Customer support (post-sale)
✗ General admin overhead
✗ Retention marketing (targets existing customers)
Customer Lifetime Value (LTV)
Simple LTV = (Average Order Value) × (Purchase Frequency) × (Customer Lifetime) × (Gross Margin %)

Example:
AOV = $156.20
Purchase Frequency = 2.4x per year
Customer Lifetime = 1.52 years (18.2 months)
Gross Margin = 64%

LTV = $156.20 × 2.4 × 1.52 × 0.64 = $364.77

Advanced LTV (Cohort Method):
Step 1: Track a customer cohort over time
Step 2: Calculate cumulative revenue by month
Step 3: Apply retention curve and gross margin
Step 4: Discount future revenue (time value of money)

Example Cohort Calculation:
Month 1:  $156 × 0.64 = $99.84 margin
Month 2:  $0 (no purchase)
Month 3:  $134 × 0.64 × 0.92 (retention) = $78.89 margin
Month 6:  $142 × 0.64 × 0.84 (retention) = $76.29 margin
Month 12: $151 × 0.64 × 0.68 (retention) = $65.71 margin
Month 18: $147 × 0.64 × 0.54 (retention) = $50.80 margin
Month 24: $139 × 0.64 × 0.41 (retention) = $36.48 margin

Total LTV = $408.01 (sum of all periods)

Note: Advanced calculations account for:
- Monthly churn rate (retention curve)
- Discount rate (typically 10-15% annually)
- Expansion revenue (upsells/cross-sells)
- Contraction (downgrades)
- Non-linear purchase patterns
Payback Period
Payback Period = CAC / (Monthly Revenue per Customer × Gross Margin %)

Example:
CAC = $122.43
Monthly Revenue per Customer = $31.24 ($156.20 AOV × 2.4 freq / 12 months)
Gross Margin = 64%

Payback Period = $122.43 / ($31.24 × 0.64) = 6.1 months

For Subscription Businesses:
Payback Period = CAC / (Monthly Subscription Price × Gross Margin)

Example (SaaS):
CAC = $890
Monthly Price = $79
Gross Margin = 85%

Payback Period = $890 / ($79 × 0.85) = 13.3 months

For Annual Upfront Payment:
Payback Period = CAC / (Annual Price × Gross Margin / 12)

Example (Annual SaaS):
CAC = $890
Annual Price = $948 (paid upfront)
Gross Margin = 85%

Payback Period = $890 / ($948 × 0.85 / 12) = 0.93 months (immediate)
Return on Ad Spend (ROAS)
ROAS = Revenue from Ads / Ad Spend

Example:
Google Search Revenue = $284,960
Google Search Spend = $28,400
ROAS = $284,960 / $28,400 = 10.0x

Or expressed as percentage: 1,000% return

Contribution Margin ROAS (more accurate):
= (Revenue × Gross Margin) / Ad Spend
= ($284,960 × 0.64) / $28,400 = 6.4x actual profit multiple

True ROI (accounts for all costs):
= (Revenue - COGS - Ad Spend - Fulfillment) / Ad Spend
= ($284,960 - $99,736 - $28,400 - $22,797) / $28,400
= $134,027 / $28,400 = 4.7x true ROI

ROAS Interpretation:
1-2x:   Losing money (unless very high LTV)
2-3x:   Break-even to slight profit
3-4x:   Decent return, room to scale
4-6x:   Strong return, scale confidently
6-10x:  Excellent, maximize spend
10x+:   Exceptional, likely underinvesting
Monthly Recurring Revenue (MRR) & Churn
MRR = Sum of all monthly subscription revenue

MRR Movement:
New MRR = New customers × average plan price
Expansion MRR = Upsells and add-ons from existing customers
Contraction MRR = Downgrades from existing customers
Churned MRR = Lost customers × their plan price

Net New MRR = New + Expansion - Contraction - Churned

Example:
Starting MRR:      $487,250
New MRR:           +$47,000 (187 customers × $251 avg)
Expansion MRR:     +$12,400 (upsells/add-ons)
Contraction MRR:   -$3,100 (downgrades)
Churned MRR:       -$13,700 (lost customers)
────────────────────────────
Ending MRR:        $529,850
Net Growth:        +$42,600 (+8.7%)

Customer Churn Rate:
= (Customers Lost in Period) / (Customers at Start of Period)
= 47 / 1,679 = 2.8% monthly churn

Revenue Churn Rate:
= (MRR Lost from Churn) / (Starting MRR)
= $13,700 / $487,250 = 2.81% monthly revenue churn

Net Revenue Retention (NRR):
= (Starting MRR + Expansion - Contraction - Churn) / Starting MRR × 100
= ($487,250 + $12,400 - $3,100 - $13,700) / $487,250 × 100
= 99.5% NRR

NRR > 100% means expansion revenue exceeds churn (ideal)
NRR 95-100% is healthy
NRR < 95% indicates retention problems
Conversion Rate & Funnel Math
Conversion Rate = (Conversions / Visitors) × 100

Example:
Visitors: 45,230
Purchases: 542
Overall CR = (542 / 45,230) × 100 = 1.2%

Stage-by-Stage Conversion:
Landing Page → Engaged:  28,043 / 45,230 = 62%
Engaged → Product View:  8,693 / 28,043 = 31%
Product → Add to Cart:   2,434 / 8,693 = 28%
Cart → Checkout:         1,022 / 2,434 = 42% (includes both checkout start and form complete)
Checkout → Purchase:     542 / 1,022 = 53%

Compound Funnel Math:
If you improve one stage, what's the overall impact?

Current: 1.2% overall conversion
If Cart → Checkout improves from 42% to 70%:
New conversion = 45,230 × 0.62 × 0.31 × 0.28 × 0.70 × 0.53
= 1,016 purchases (up from 542)
= +87% increase from fixing one stage

Value of 1 Percentage Point:
Current: 542 sales at 1.2% = $167,054 revenue
+0.1%: 587 sales = +$13,890 monthly (+$166,680 annual)
+0.5%: 768 sales = +$69,732 monthly (+$836,784 annual)
+1.0%: 995 sales = +$139,754 monthly (+$1,677,048 annual)
Common Mistakes
1. Tracking Too Many Metrics
The Problem: When everything is measured, nothing is prioritized. Teams spend more time collecting data than acting on insights.
Real Example: A client's marketing dashboard tracked 147 different metrics across 8 platforms. Weekly meetings involved 45-minute presentations reviewing every metric. The team could describe every number but couldn't articulate what actions they should take.
The Fix: We cut their dashboard to 12 core metrics across 3 tiers (1 North Star, 5 Leading Indicators, 6 Diagnostics). Meeting time dropped to 15 minutes and focused entirely on decisions. Revenue improved 34% in the next quarter because the team focused on moving the right numbers.
Rule of Thumb:
- Executive dashboard: 5-7 metrics max
- Department dashboards: 10-12 metrics max
- Individual contributor: 3-5 metrics max
2. Measuring Inputs Instead of Outcomes
The Problem: Activity metrics (inputs) feel productive but don't guarantee results (outcomes).
The Fix: For every activity metric, ask "So what?" until you connect it to revenue, cost savings, or customer value.
3. Comparing Incomparable Metrics
The Problem: Context-free metrics are meaningless. A 3% conversion rate could be excellent or terrible depending on traffic source and intent.
Example of Misleading Comparison:
The Fix: Always benchmark within channel and context:
- Compare brand search only to other brand search
- Compare cold traffic only to similar cold traffic
- Segment by traffic intent and funnel stage
Proper Benchmarking Framework:
4. Optimizing for Metrics Instead of Business
The Problem: You can improve almost any metric in ways that hurt your business.
Real Examples of Metric Gaming:
The Fix: Always tie metrics to business outcomes:
- Will improving this metric increase revenue or reduce costs?
- What's the second-order effect of optimizing this metric?
- Are we solving for the metric or solving for the business?
Metric Optimization Checklist:
Before optimizing any metric, answer these questions:
5. Using Average When You Need Median
The Problem: Averages are heavily skewed by outliers. Medians reveal the typical experience.
Example: Average Deal Size is Misleading:
- Average deal size: $3,920 (inflated by one outlier)
- Median deal size: $2,750 (typical deal)
- Leadership sees: $3,920 average and expects sales team to close deals at that size
- Reality: 98% of deals are $2,400-$3,200
This mismatch creates unrealistic forecasts and poor strategic decisions.
When to Use Each:
6. Ignoring Statistical Significance
The Problem: Declaring winners too early or with too little data.
Real Example: A client ran an A/B test on checkout flow:
- Variant A: 127 visitors, 8 conversions (6.3%)
- Variant B: 134 visitors, 12 conversions (9.0%)
- Their conclusion: "Variant B wins! +43% lift!"
The reality: With this sample size, the result is not statistically significant (p-value = 0.31). The "winner" could easily be random chance.
Minimum Sample Sizes for Valid A/B Tests:
The Fix:
- Use a statistical significance calculator before declaring a winner
- Aim for 95% confidence minimum
- Run tests until you hit required sample size
- For low-traffic sites, test bigger changes that require less data
Ready to Focus on What Matters?
If your reporting feels cluttered and confusing, or if you're not sure which metrics should drive your decisions, let's talk. We'll help you build a metrics framework that focuses on what actually matters for your business.
Need strategic guidance on building your measurement foundation? Explore our Growth Strategy services for comprehensive marketing leadership that connects metrics to business outcomes. If your paid channels are underperforming, our paid media experts can optimize your Google Ads, Meta, and LinkedIn campaigns for better CAC and ROAS.
What You'll Get:
- Metrics Audit: We'll review your current dashboard and identify what's actually driving business value
- Custom Framework: We'll design a 3-tier metrics system tailored to your business model and growth stage
- Dashboard Build: We'll implement tracking and reporting that connects metrics to decisions
- Team Training: We'll help your team understand what to measure, why it matters, and how to act on it
Our Approach:
- Week 1: Metrics audit and stakeholder interviews
- Week 2: Design custom framework and get alignment
- Week 3: Implement tracking and build dashboards
- Week 4: Train team and refine based on feedback
Investment: Starting at $8,500 for complete metrics system design and implementation.