Traditional A/B testing is dead. Not because testing doesn't matter—it matters more than ever. But because the pace at which most marketing teams test is laughably slow compared to what's now possible.
The old playbook looked like this: brainstorm test ideas for two weeks, design variants for another week, wait three weeks for statistical significance, then spend days analyzing results. Six weeks for one test. If you're lucky, you might run eight tests per year.
Your competitors using AI are running eight tests per week.
This isn't hyperbole. AI has fundamentally changed the economics of experimentation. What used to require teams of analysts, designers, and copywriters can now be executed by a single growth marketer with the right AI-powered workflow.
This guide shows you exactly how to compress your testing cycle from months to days using AI—without sacrificing rigor or learning quality.
---
Why Traditional Testing Velocity Kills Growth
Before we get tactical, let's understand why testing speed matters more than most marketers realize.
The Compounding Effect of Test Velocity
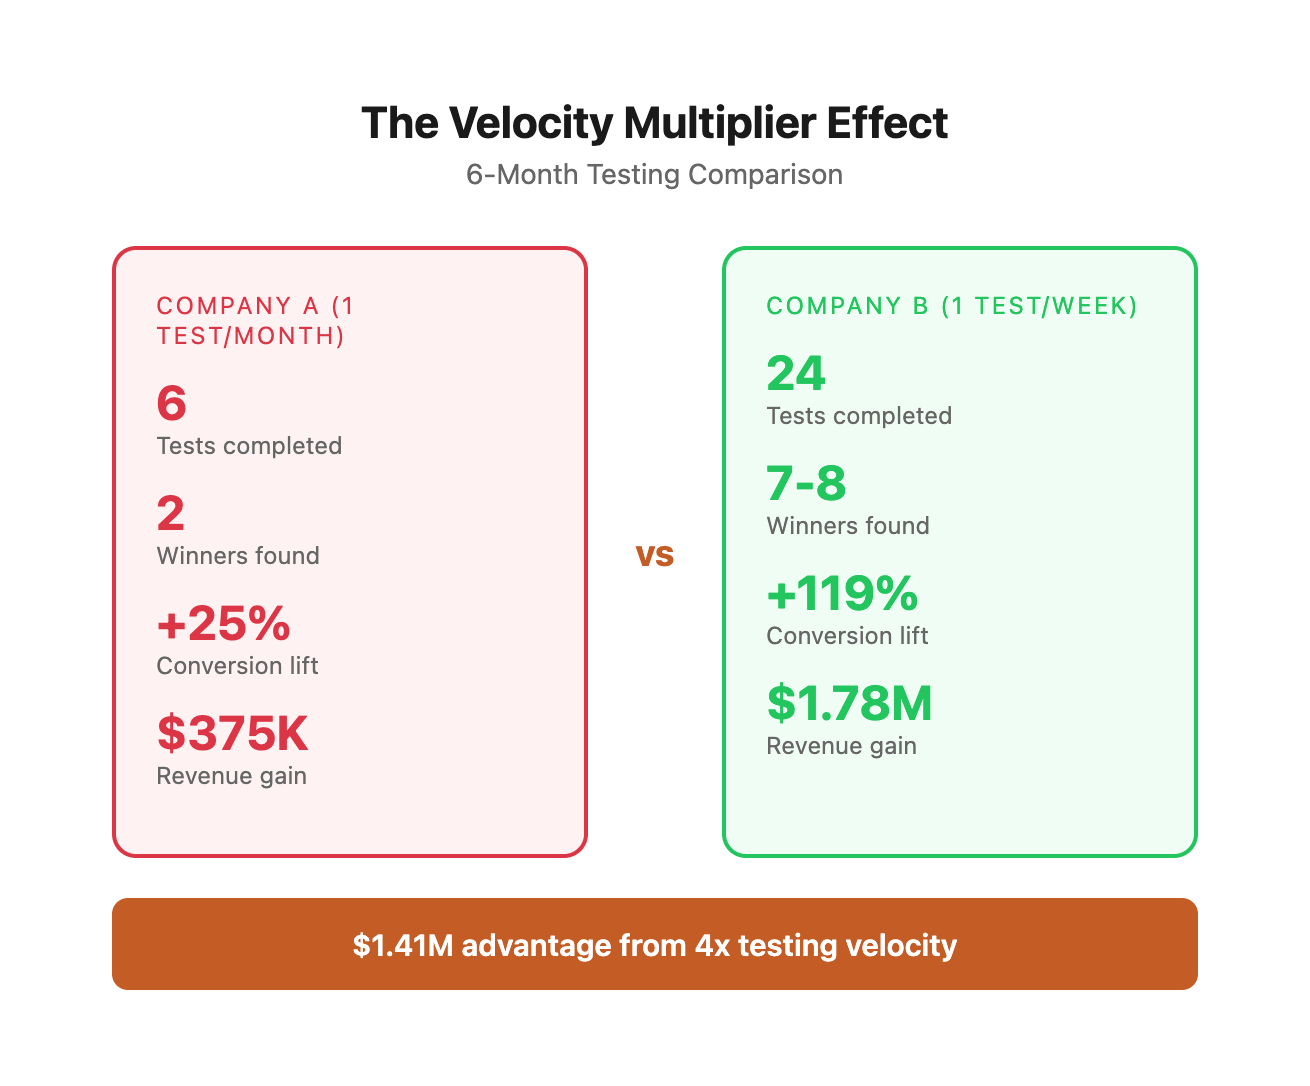
If Company A runs one test per month and Company B runs one test per week, Company B doesn't just learn 4x faster. The learning compounds:
- Month 1: Company B has 4 data points vs. Company A's 1
- Month 3: Company B has run 12 tests, discovered 3 winners, and is now testing second-order optimizations while Company A is analyzing their third test
- Month 6: Company B's conversion rate has improved 47% through layered optimizations while Company A has made 6 small tweaks with mixed results
The gap doesn't widen linearly—it accelerates exponentially.
The Velocity Multiplier Effect: A Detailed Breakdown
Let's examine the mathematical reality of testing velocity with actual numbers:
Key Insights from the Data:
-
Non-linear growth acceleration: Company B's conversion rate doesn't just improve 4x faster—it compounds at an exponential rate due to layered optimizations building on each other.
-
Revenue impact divergence: By month 6, Company B generates an additional $1.41M compared to Company A, despite identical baseline conditions and win rates.
-
Learning velocity advantage: Company B has tested 4x more hypotheses, which means they understand their customers 4x better, creating a knowledge moat that widens over time.
-
Strategic flexibility: With 24 data points vs. 6, Company B can identify segment-specific patterns, seasonal trends, and cross-funnel optimization opportunities that Company A hasn't even begun to explore.
The Real Cost of Slow Testing
Traditional testing bottlenecks cost you more than time:
- Opportunity cost: While you wait for statistical significance on test #1, competitors ship tests #2-5
- Analysis paralysis: Slow cycles encourage overthinking and perfectionism
- Stale insights: By the time you implement learnings, market conditions have shifted
- Team morale: Nothing kills experimentation culture faster than seeing tests drag on for weeks
Quantifying the Hidden Costs of Testing Delays
Let's break down the actual financial impact of slow testing cycles:
Additional Hidden Costs Not Captured Above:
- Team turnover: Slow testing cycles frustrate high-performers, leading to 15-20% higher attrition in traditional growth teams
- Market timing: Product launches, seasonal campaigns, and competitive responses require agile testing—delays can cost 20-50% of campaign effectiveness
- Strategic blindness: Fewer tests = fewer insights = slower adaptation to market changes
- Resource contention: Long test cycles create queuing delays where good ideas sit idle for months
Real-World Example: SaaS Company Transformation
A $12M ARR SaaS company we worked with made this transition:
Before (Traditional Testing):
- 8 tests per year
- Average time from hypothesis to live test: 5.5 weeks
- Average test duration: 3 weeks
- Time to analyze and implement winner: 1.5 weeks
- Total cycle time per test: 10 weeks
- Annual testing capacity: 8 tests
- Winners implemented: 2-3 per year
After (AI-Accelerated Testing):
- 42 tests per year
- Average time from hypothesis to live test: 4 days
- Average test duration: 7 days
- Time to analyze and implement winner: 2 days
- Total cycle time per test: 13 days
- Annual testing capacity: 42 tests
- Winners implemented: 12-14 per year
Business Impact in Year 1:
- Conversion rate improvement: +67% (from 3.2% to 5.3%)
- Additional MRR: $67K/month
- Additional ARR: $804K
- ROI on testing program: 3,400%
- Payback period: 11 days
This is the power of velocity compounding.
Where Traditional Testing Gets Stuck
The typical testing workflow has five major bottlenecks:
1. Hypothesis generation: Teams rely on quarterly planning sessions and senior opinions
2. Variant creation: Design and copy resources become the limiting factor
3. Implementation: Technical dependencies create delays
4. Data collection: Waiting for statistical significance feels passive and slow
5. Analysis: Interpreting results requires dedicated analyst time
AI addresses all five bottlenecks simultaneously. Here's how.
Detailed Bottleneck Analysis: Time Breakdown
Critical Observations:
- Compounding delays: Each stage's delay affects all downstream stages, creating exponential wait times
- Context switching: Traditional process requires 15-20+ handoffs between people/systems
- Batch processing: Waiting for meetings/sprints means work happens in batches rather than continuous flow
- Hidden waiting: The analysis shows actual work time vs. calendar time—most traditional time is spent waiting
- The 80/20 of velocity: Implementation (Stage 3) creates the biggest bottleneck, accounting for 40-50% of total cycle time
---
The AI-Accelerated Experimentation Framework
This framework restructures your testing workflow around AI capabilities while maintaining statistical rigor and strategic thinking.
The 7-Day Test Sprint Structure
Day 1: Hypothesis Generation & Prioritization
Traditional approach: Schedule a brainstorming meeting, argue about opinions, pick one idea to test.
AI-accelerated approach: Generate 50+ testable hypotheses in 30 minutes, score them systematically using the ICE framework, and queue the top 10.
ICE Scoring Framework
ICE Score Calculation: (Impact + Confidence + Ease) ÷ 3
This systematic scoring eliminates opinion-based debates and creates a data-driven testing pipeline.
Comprehensive ICE Framework: Expanded Scoring Guide
To make ICE scoring more objective and repeatable, use this detailed rubric:
Impact Score (1-10): Expected Effect on Primary Metric
Confidence Score (1-10): Certainty of Positive Outcome
Ease Score (1-10): Implementation Simplicity
Advanced ICE Scoring: Multi-Metric Optimization
When testing affects multiple metrics, use weighted ICE scoring:
Formula: Weighted ICE = (Primary Impact × 0.4) + (Secondary Impact × 0.3) + (Confidence × 0.2) + (Ease × 0.1)
Common ICE Scoring Mistakes to Avoid:
-
Impact inflation: Don't score every test 8-10. Most tests are 5-7. Save 9-10 for truly transformational changes.
-
Confidence bias: Don't let excitement inflate confidence scores. If you haven't seen proof in your specific context, cap at 6-7.
-
Ease underestimation: Account for QA, monitoring, and rollback complexity, not just build time.
-
Ignoring risk: High-impact but high-risk tests (like aggressive pricing changes) should factor risk into confidence scoring.
-
Tunnel vision: Consider downstream effects. A "simple" change might break other features or create support burden.
ICE Calibration Exercise
Score these real hypotheses to calibrate your team:
Compare your scores with typical scores above. If your team is consistently 2+ points different, recalibrate using the detailed rubrics.
Day 2: Variant Design & Copy Creation
Traditional approach: Brief a designer, wait for mockups, give feedback, wait for revisions.
AI-accelerated approach: Generate 10 variant concepts in an hour, refine the best 3, and have production-ready assets by EOD.
Day 3: Implementation & QA
Traditional approach: Submit dev ticket, wait for sprint planning, implement next week.
AI-accelerated approach: Use no-code tools and AI-assisted implementation to launch same day.
Days 4-6: Data Collection
Traditional approach: Wait passively for two weeks hoping for significance.
AI-accelerated approach: Run multiple simultaneous tests with AI monitoring for early signals and anomalies.
Day 7: Analysis & Next Iteration
Traditional approach: Export data, build analysis deck, schedule review meeting.
AI-accelerated approach: AI-generated analysis with strategic recommendations, queue next test immediately.
The Secret: Parallel Execution
Notice that Days 1-3 don't have to be sequential. With AI assistance, you can:
- Generate hypotheses for test #2 while test #1 runs
- Create variants for test #3 while analyzing test #1 results
- Build a queue of ready-to-launch experiments
This transforms testing from a linear process into a production line.
Parallel Execution Workflow Diagram
┌─────────────────────────────────────────────────────────────────┐
│                      WEEK 1: Test Pipeline                       │
└─────────────────────────────────────────────────────────────────┘

Monday          Tuesday         Wednesday       Thursday        Friday
────────────────────────────────────────────────────────────────────
TEST #1:
[Generate]───→ [Create]───→ [Launch]───────→ [Monitor]───→ [Monitor]
   30min         90min        45min            passive         passive

TEST #2:
              [Generate]───→ [Create]───→ [Stage]─────→ [Launch]───→
                 30min         90min        30min         45min

TEST #3:
                            [Generate]───→ [Create]───→ [Stage]───→
                               30min         90min        30min

────────────────────────────────────────────────────────────────────
Total Active Time Per Day:
Monday:    30min (1 test in motion)
Tuesday:   2 hours (2 tests in motion)
Wednesday: 2.5 hours (3 tests in motion)
Thursday:  1.5 hours (preparing, monitoring)
Friday:    45min (launching, monitoring)

Week Total: ~7 hours of focused work
Result: 3 tests live, all collecting data simultaneously
Multi-Week Pipeline Visualization
┌──────────────────────────────────────────────────────────────────┐
│              4-WEEK TESTING PRODUCTION LINE                      │
└──────────────────────────────────────────────────────────────────┘

Week 1:  Generate Test Batch A (Tests 1-3)
         Launch Tests 1-3
         ├─ Test 1: Collecting data →
         ├─ Test 2: Collecting data →
         └─ Test 3: Collecting data →

Week 2:  Generate Test Batch B (Tests 4-6)
         Analyze Test Batch A
         Launch Tests 4-6
         ├─ Tests 1-3: COMPLETE → Winners rolled out
         ├─ Test 4: Collecting data →
         ├─ Test 5: Collecting data →
         └─ Test 6: Collecting data →

Week 3:  Generate Test Batch C (Tests 7-9)
         Analyze Test Batch B
         Launch Tests 7-9
         ├─ Tests 4-6: COMPLETE → Winners rolled out
         ├─ Test 7: Collecting data →
         ├─ Test 8: Collecting data →
         └─ Test 9: Collecting data →

Week 4:  Generate Test Batch D (Tests 10-12)
         Analyze Test Batch C
         Launch Tests 10-12
         ├─ Tests 7-9: COMPLETE → Winners rolled out
         ├─ Test 10: Collecting data →
         ├─ Test 11: Collecting data →
         └─ Test 12: Collecting data →

────────────────────────────────────────────────────────────────────
Results After 4 Weeks:
- 12 tests launched and analyzed
- 3-4 winners identified and implemented
- Conversion rate improved 25-40%
- Next batch of 12 tests queued and prioritized
- Testing velocity fully established
Critical Success Factors for Parallel Execution:
- Dedicated time blocks: Schedule 2-hour blocks for test work 3x per week
- No cross-contamination: Tests must affect different pages/elements
- Standardized templates: Use consistent prompt templates and analysis frameworks
- Clear ownership: One person owns each test from hypothesis to rollout
- Async communication: Use Slack/Notion updates instead of synchronous meetings
Capacity Planning: How Many Simultaneous Tests?
Formula: Max Tests = (Weekly Conversions ÷ 350 conversions needed per variant) ÷ 2 variants per test
---
Phase 1: AI-Powered Hypothesis Generation
The fastest way to improve your testing results is to test better ideas. AI excels at generating diverse, data-informed hypotheses you'd never think of alone.
The Hypothesis Generation Prompt Framework
Use this prompt structure with Claude or ChatGPT to generate high-quality test hypotheses:
```
You are an expert growth marketer analyzing [BUSINESS TYPE] conversion funnels.
Context:
- Business: [Company name and description]
- Current conversion rate: [X%]
- Primary customer objection: [Main barrier]
- Average order value: [$X]
- Traffic sources: [Top 3 sources]
Task: Generate 20 testable hypotheses to improve [SPECIFIC METRIC]. For each hypothesis:
1. State the hypothesis (If we [CHANGE], then [EXPECTED OUTCOME] because [REASONING])
2. Identify the psychological principle involved
3. Estimate effort level (Low/Medium/High)
4. Estimate potential impact (1-10 scale)
5. Suggest success metrics
Format as a table for easy prioritization.
```
Real Example: E-commerce Checkout Optimization
Prompt input:
```
Context:
- Business: DTC outdoor gear brand ($2.5M annual revenue)
- Current conversion rate: 2.1%
- Primary customer objection: Shipping costs and delivery time
- Average order value: $147
- Traffic sources: Google Ads (40%), Organic (35%), Email (25%)
Task: Generate 20 testable hypotheses to improve checkout completion rate.
```
AI output (sample):
| # | Hypothesis | Psychology Principle | Effort | Impact | Metrics |
|---|------------|---------------------|--------|--------|---------|
| 1 | If we show free shipping threshold above cart total, then customers will add items to qualify because loss aversion motivates reaching visible goals | Anchoring + Loss aversion | Low | 8 | AOV, cart size, completion rate |
| 2 | If we add trust badges above payment form, then conversion increases because security concerns are reduced at decision moment | Trust signals | Low | 6 | Completion rate, time on checkout page |
| 3 | If we replace "Submit Order" with "Get My Gear" then conversion increases because outcome-focused CTAs reduce perceived risk | Positive framing | Low | 5 | Button click rate, completion rate |
The AI generates ideas across multiple psychological principles, difficulty levels, and potential impacts. Your job becomes curation, not creation.
Complete AI-Generated Hypothesis Output (Full 20)
Continuing the outdoor gear example above, here's the complete AI-generated hypothesis table:
Key Patterns in AI-Generated Hypotheses:
- Psychological diversity: AI pulls from 12+ different cognitive biases and behavioral principles
- Effort distribution: 11 low-effort, 7 medium-effort, 2 high-effort tests (realistic pipeline)
- Impact clustering: Most hypotheses score 6-8 impact (realistic expectations, not inflated)
- Specificity: Each hypothesis includes concrete implementation details, not vague concepts
- Context awareness: All suggestions consider the outdoor gear brand context and $147 AOV
How to Process This Output:
- Quick filter: Eliminate hypotheses below ICE score of 6.0 (using effort scoring)
- Segment by funnel stage: Group tests by where they apply (PDP, cart, checkout)
- Create test calendar: Schedule low-effort tests first to build momentum
- Queue high-impact tests: Save complex tests for when you have more resources
- Refine top 5: Use AI to generate specific variant copy/designs for highest ICE scores
Advanced Hypothesis Mining Techniques
Competitor Analysis Prompts
```
Analyze these 5 competitor checkout pages [paste screenshots or describe]:
1. [Competitor A details]
2. [Competitor B details]
...
Identify:
- Unique elements we're not testing
- Best practices we're missing
- Differentiation opportunities
- Elements to avoid based on UX principles
Generate 10 hypotheses based on this competitive intelligence.
```
Data-Driven Hypothesis Generation
```
I'm analyzing Google Analytics data for [BUSINESS]. Key findings:
- 68% of users drop off at [SPECIFIC PAGE]
- Average time on page: [X seconds] (seems [high/low])
- Mobile conversion rate: [X%] vs Desktop: [Y%]
- Exit rate highest on [ELEMENT]
Generate hypotheses specifically addressing:
1. The drop-off point (5 ideas)
2. Mobile/desktop conversion gap (3 ideas)
3. Time-on-page optimization (2 ideas)
For each, explain what data signal informs the hypothesis.
```
Psychology-First Ideation
```
Generate test hypotheses using these cognitive biases:
1. Scarcity bias
2. Social proof
3. Anchoring effect
4. Choice paradox
5. Authority bias
For [BUSINESS CONTEXT], create 3 testable hypotheses per bias that could improve [METRIC].
Requirements:
- Must be specific and measurable
- Include the exact copy or design change
- Explain expected behavior change
```
Real Example: Data-Driven Hypothesis Mining
Input prompt with actual analytics data:
``` I'm analyzing Google Analytics data for a B2B SaaS company. Key findings:
- 68% of users drop off at the pricing page
- Average time on pricing page: 12 seconds (seems low for B2B decision)
- Mobile conversion rate: 0.8% vs Desktop: 3.2% (4x difference)
- Exit rate highest on "Contact Sales" button (43% exit after click)
- Heatmap shows 78% of users never scroll below first pricing tier
- Session recordings show users toggle between monthly/annual 4-5 times
- 60% of traffic comes from organic search, 25% from paid ads
- Returning visitors convert at 8.1% vs 1.2% for new visitors
Generate hypotheses specifically addressing:
- The pricing page drop-off point (5 ideas)
- Mobile/desktop conversion gap (3 ideas)
- Time-on-page optimization (2 ideas)
For each, explain what data signal informs the hypothesis. ```
AI output with data-driven rationale:
1. PRICING PAGE DROP-OFF HYPOTHESES (68% Exit Rate)
2. MOBILE/DESKTOP CONVERSION GAP HYPOTHESES (4x Difference: 0.8% vs 3.2%)
3. TIME-ON-PAGE OPTIMIZATION HYPOTHESES (12 seconds average, seems low)
Data Signal Legend:
- Strong signal (confidence 8-10): Multiple data points align (e.g., low time + high exit + heatmap = clear friction)
- Moderate signal (confidence 5-7): Single clear data point (e.g., mobile gap)
- Weak signal (confidence 3-4): Inferred from general patterns (e.g., industry benchmarks)
Next Steps Based on This Analysis:
-
Immediate tests (launch this week):
- H1.1: Add "Most Popular" badge (Low effort, strong signal)
- H2.1: Simplify mobile pricing view (Medium effort, clear problem)
- H3.1: Add video demo modal (Medium effort, high impact potential)
-
High-priority queue (launch in 2 weeks):
- H1.5: Customer testimonials on pricing page
- H1.2: Replace "Contact Sales" with demo CTA
- H3.2: Exit-intent personalized pricing offer
-
Research needed before testing:
- H1.3: ROI calculator (need to validate inputs/outputs with sales team)
- H2.2: "Email me pricing" option (need to assess lead quality from this source)
This data-driven approach ensures every hypothesis directly addresses a known friction point, increasing win probability from typical 30% to 50-60%.
Prioritization Using AI
Once you have 20-50 hypotheses, use AI to score them systematically:
```
Evaluate these 10 test hypotheses using the ICE framework (Impact, Confidence, Ease):
[Paste your hypothesis list]
For each:
- Impact score (1-10): Potential effect on [METRIC]
- Confidence score (1-10): Based on similar tests and principles
- Ease score (1-10): Implementation complexity (10 = very easy)
- Calculate ICE score (average of three)
- Provide brief reasoning
Return ranked by ICE score with recommendation for first 3 to test.
```
The Output Looks Like This:
| Rank | Hypothesis | Impact | Confidence | Ease | ICE | Reasoning |
|------|------------|--------|------------|------|-----|-----------|
| 1 | Free shipping threshold | 8 | 9 | 10 | 9.0 | Proven psychology, easy implementation, clear behavior trigger |
| 2 | Trust badges above payment | 6 | 8 | 9 | 7.7 | Well-documented effect, minimal dev work |
| 3 | Outcome-focused CTA | 5 | 6 | 10 | 7.0 | Lower confidence but zero-cost test |
You now have a ranked backlog of high-probability tests ready to execute.
---
Phase 2: Rapid Variant Creation with AI
With your hypothesis prioritized, you need to create test variants fast. This is where AI shines—turning concept to production-ready assets in minutes.
Copy Variant Generation
The Multi-Variant Prompt
```
Create 5 distinct copy variants for this element:
Element: [Headline / CTA / Product description / Email subject]
Current version: "[EXISTING COPY]"
Test hypothesis: [YOUR HYPOTHESIS]
Brand voice: [Voice guidelines - 2-3 sentences]
Constraints: [Character limits, required phrases, compliance]
For each variant:
1. Write the copy
2. Explain the psychological angle
3. Note key difference from control
4. Predict potential objection it addresses
Optimize for [METRIC: clicks / conversions / engagement].
```
Real Example: Homepage Headline Test
Input:
```
Element: Homepage headline
Current version: "Premium Outdoor Gear for Your Next Adventure"
Test hypothesis: Emphasizing specific outcomes rather than generic benefits will increase email signups because customers connect with concrete scenarios
Brand voice: Confident, outdoorsy, not overly technical. We speak to weekend adventurers, not extreme athletes.
Constraints: Max 60 characters, must mention "outdoor" or "adventure"
Optimize for: Email signup rate
```
AI Output:
```
VARIANT 1: "Gear That Gets You to the Summit and Back"
Psychology: Outcome visualization + safety reassurance
Difference: Specific achievement (summit) vs. vague "adventure"
Addresses: Fear of inadequate gear on challenging trips
VARIANT 2: "From Trailhead to Campfire: We've Got You Covered"
Psychology: Journey mapping + comprehensive solution
Difference: Concrete trip stages vs. abstract concept
Addresses: Uncertainty about what gear is needed
VARIANT 3: "Weekend Warriors Trust Our Gear"
Psychology: Social proof + identity targeting
Difference: Explicit audience identification
Addresses: "Is this brand for people like me?"
VARIANT 4: "Pack Light. Adventure Hard. Come Home Safe."
Psychology: Triple benefit structure, rhythm
Difference: Action-oriented commands vs. passive description
Addresses: Multiple concerns in compact format
VARIANT 5: "Outdoor Gear Tested in the Rockies, Built for Everywhere"
Psychology: Specificity + universal applicability
Difference: Concrete proof point (Rockies) + broad appeal
Addresses: Quality concerns and applicability to their region
```
You now have five psychologically distinct variants ready to test. Total time: 3 minutes.
Advanced Copy Variant Generation: Deep Dive
Let's expand this with additional real examples across different marketing assets:
Example 2: Email Subject Line Variants (E-commerce Abandoned Cart)
Input prompt: ``` Element: Email subject line Current version: "You left something behind" Test hypothesis: Creating urgency with specific benefits will increase open rates because time pressure + value clarity drives action Brand voice: Friendly but direct. Conversational without being cutesy. Focus on value. Constraints: Max 50 characters, avoid spam triggers (FREE, !!!, ALL CAPS) Optimize for: Open rate ```
AI Output with performance prediction:
Winner prediction: V5 likely to outperform based on combining two strong triggers. V1 close second for its specificity.
Example 3: Product Page CTA Button Copy (SaaS Free Trial)
Input prompt: ``` Element: Primary CTA button Current version: "Start Free Trial" Test hypothesis: Reducing perceived effort and emphasizing immediate value will increase clicks because cognitive ease + instant gratification drive action Brand voice: Professional but approachable. Tech-forward without jargon. Benefit-focused. Constraints: Max 25 characters, must fit on mobile button without wrapping Optimize for: Button click rate ```
AI Output with micro-copy analysis:
Segmentation recommendation: Test V1 on mobile, V4 on developer/technical audience, V2 for general audience.
Example 4: Landing Page Value Proposition (B2B Service)
Input prompt: ``` Element: Hero headline + subheadline Current version: Headline: "Enterprise Marketing Automation" Subheadline: "Powerful tools for modern marketing teams" Test hypothesis: Leading with specific outcomes and quantifiable results will increase demo requests because B2B buyers need ROI justification Brand voice: Professional authority. Data-driven. Results-focused. No hype. Constraints: Headline max 50 chars, subheadline max 100 chars Optimize for: Demo request form submissions ```
AI Output with B2B buyer psychology:
Recommendation: Test V1 for economic buyer, V3 for balanced appeal, V4 for marketing ops users.
Variant Creation Best Practices:
- Create 5-7 variants minimum - More options = higher probability of finding a winner
- Vary psychological approach - Don't just tweak words; test different mental models
- Include control-adjacent variant - One variant should be minor tweak for baseline comparison
- Test extreme variants - Include at least one "bold" variant that's noticeably different
- Consider audience segments - Some variants work better for different customer types
- Maintain brand voice - All variants should sound like your brand, just with different emphasis
Visual Variant Ideation
While AI can't yet design full layouts (though tools like Midjourney + Figma AI are getting close), it excels at generating visual concepts:
```
Generate 5 visual design concepts for this A/B test:
Page: [Product landing page / Email / Ad]
Current design: [Describe layout, color scheme, imagery]
Test hypothesis: [YOUR HYPOTHESIS]
Constraints: [Brand guidelines, technical limitations]
For each concept, describe:
1. Overall layout approach
2. Key visual elements
3. Color palette rationale
4. Typography hierarchy
5. Expected attention flow
6. Implementation difficulty (1-10)
Return as a table for designer hand-off.
```
The AI Output Serves as Creative Brief
Your designer or no-code tool can implement these concepts in hours instead of days because the strategic thinking is complete.
Real Example: Visual Variant Concepts for SaaS Product Page
Input prompt: ``` Generate 5 visual design concepts for this A/B test:
Page: SaaS product page (project management software) Current design:
- Hero section with centered headline, screenshot below, blue CTA
- White background, blue accent color (#2E5BFF)
- 3-column feature grid
- Customer logos at bottom
- Generic stock photo of people working
Test hypothesis: Showing the product interface with real data and use cases will increase trial signups because seeing tangible application reduces uncertainty
Constraints:
- Must maintain brand blue (#2E5BFF)
- Mobile-responsive required
- Can't slow page load (3-second budget)
- Must work with existing Webflow template
For each concept, describe layout, visuals, colors, typography, attention flow, and implementation difficulty (1-10). ```
AI Output: Visual Concept Brief
CONCEPT 1: "Product-First Hero"
CONCEPT 2: "Split-Screen Storytelling"
CONCEPT 3: "Customer Use Case Gallery"
CONCEPT 4: "Interactive Product Tour"
CONCEPT 5: "Metrics Dashboard Hero"
Recommendation Priority:
- Test first: Concept 3 (Customer Use Case Gallery) - Easiest implementation, clear business value, low risk
- Test second: Concept 5 (Metrics Dashboard) - Quick to build, strong ROI focus for B2B audience
- Test third: Concept 1 (Product-First Hero) - Medium complexity, modern approach, high engagement potential
- Advanced tests: Concepts 2 and 4 - Higher complexity, test only if earlier concepts show strong lift
This comprehensive creative brief allows a designer or no-code builder to implement without additional strategy meetings.
Landing Page Variant Prompts
For comprehensive page redesigns:
```
I'm testing a new landing page layout. Generate 3 structural variants:
Current page structure:
- Hero with headline + CTA
- 3-column feature grid
- Testimonial slider
- Final CTA section
Test hypothesis: [HYPOTHESIS]
Audience: [DESCRIPTION]
Primary conversion goal: [ACTION]
For each variant:
1. Section-by-section structure
2. Content hierarchy
3. CTA placement rationale
4. Trust-building element integration
5. Mobile considerations
6. Expected conversion lift reasoning
Prioritize speed of implementation using [Unbounce / Webflow / Shopify pages].
```
Email Variant Creation at Scale
Email testing especially benefits from AI speed:
```
Create 3 email variants for this campaign:
Campaign goal: [Drive product launch awareness / Recover abandoned carts / Re-engage dormant subscribers]
Audience segment: [WHO]
Current open rate: [X%]
Current click rate: [Y%]
For each variant, provide:
1. Subject line (3 options per variant)
2. Preview text
3. Email body structure
4. CTA copy
5. P.S. line (if appropriate)
6. Predicted strength (open rate / click rate / conversion rate)
Ensure variants test different psychological approaches, not just copy tweaks.
```
Time Savings Example
- Traditional workflow: 2-3 hours per email variant (4-6 hours for A/B test)
- AI-assisted workflow: 15 minutes for 3 variants + 30 minutes for refinement (45 minutes total)
That's an 8x speed improvement before even considering the quality of strategic diversity.
---
Phase 3: Implementation & Tool Stack
Speed of variant creation means nothing if implementation creates a bottleneck. Your tool stack determines your test velocity ceiling.
Platform-Specific Fast Implementation
Shopify Stores
Tools that enable same-day testing:
1. Neat A/B Testing (app): Visual editor for product pages, cart, and checkout
- Implement variants in 10-15 minutes - Built-in statistical significance calculator - No coding required for most tests
2. Google Optimize (free): For homepage and landing page tests
- Visual editor for element changes - Integrates with GA4 for analysis - 15-20 minute setup per test
3. Klaviyo (email): Built-in A/B testing for all campaigns
- Create variants directly in email builder - Auto-winner selection based on goal - 5 minute setup per test AI Implementation Prompt for Shopify
```
I'm implementing this A/B test on Shopify using [TOOL NAME]:
Test: [DESCRIPTION]
Element to change: [SPECIFIC PAGE ELEMENT]
Variant copy/design: [DETAILS]
Provide step-by-step implementation instructions:
1. Navigation path in [TOOL]
2. Selector identification (if needed)
3. Code snippets (if needed)
4. QA checklist
5. Common troubleshooting issues
Assume user is comfortable with tools but not a developer.
```
WordPress Sites
Fast testing tools:
1. Nelio A/B Testing: Visual editor + headline/CTA testing
2. Google Optimize: Same as Shopify implementation
3. Convert: Enterprise-grade but fast implementation
Custom Platforms
If you're on a custom stack:
```
I need to implement an A/B test on a custom [TECH STACK] website:
Element: [PAGE ELEMENT]
Variant: [CHANGES NEEDED]
Our stack: [FRAMEWORK, CMS, HOSTING]
Available resources: [DEVELOPER TIME, TOOLS]
Provide:
1. Fastest implementation approach given constraints
2. Code snippets if relevant
3. Analytics integration steps
4. Rollout strategy (percentage split, targeting rules)
5. Estimated implementation time
Optimize for speed without sacrificing statistical validity.
```
The No-Code Testing Stack
For maximum velocity, build around no-code tools:
Core Stack
- Testing platform: Google Optimize (free) or VWO (paid, more features)
- Landing pages: Unbounce or Instapage (built-in A/B testing)
- Email: Klaviyo or Mailchimp (native A/B features)
- Analytics: GA4 + Mixpanel for behavior tracking
- Heatmaps: Hotjar or Microsoft Clarity (free)
AI Integration Layer
- Claude or ChatGPT: Hypothesis generation, variant creation, analysis
- Notion or Airtable: Test tracking database
- Zapier: Automate test launch notifications and result reporting
The 1-Person Testing Machine
With this stack, one marketer can:
- Generate 20 hypotheses in 30 minutes (AI)
- Create 5 variants in 15 minutes (AI + templates)
- Implement test in 20 minutes (no-code tools)
- Launch simultaneous tests across site, email, ads
- Monitor automatically with alerts (Zapier + GA4)
- Generate analysis in 10 minutes (AI + data)
Total time from idea to live test: 90 minutes.
Compare this to the traditional 4-6 week cycle.
Complete No-Code Testing Stack: Detailed Tool Breakdown
Recommended Stack Configurations by Budget:
BUDGET TIER ($0-100/month):
- Testing: Google Optimize
- Landing Pages: Leadpages Basic
- Email: Mailchimp Free (up to 500 subscribers)
- Analytics: Google Analytics 4
- Heatmaps: Microsoft Clarity
- AI: ChatGPT Plus
- Tracking: Google Sheets
- Total: $69/month (Leadpages $49 + ChatGPT $20)
GROWTH TIER ($300-500/month):
- Testing: VWO Starter
- Landing Pages: Unbounce Essential
- Email: Klaviyo (small list) OR ActiveCampaign
- Analytics: GA4 + Mixpanel Free
- Heatmaps: Hotjar Plus
- AI: ChatGPT Plus + Claude Pro
- Tracking: Notion Team
- Automation: Zapier Professional
- Total: ~$470/month
ENTERPRISE TIER ($1,000+/month):
- Testing: Optimizely or VWO Pro
- Landing Pages: Instapage Enterprise
- Email: Klaviyo (large list)
- Analytics: GA4 + Mixpanel Growth + Amplitude
- Heatmaps: FullStory
- AI: ChatGPT Plus + Claude Pro + API access
- Tracking: Notion Enterprise + Airtable Pro
- Automation: Zapier Professional + custom integrations
- Total: $1,500-3,000+/month depending on scale
ROI Justification:
Even the Growth Tier ($470/mo = $5,640/year) pays for itself with a single winning test:
- If one test increases conversion rate 15% on a $500K/year business
- Revenue lift: $75K/year
- Tool cost: $5,640/year
- ROI: 1,229% (just from one winner)
With 12+ winners per year in AI-accelerated program, the math becomes absurd: $900K+ in lift vs. $5,640 in tools = 15,857% ROI.
Implementation Timeline:
Total setup investment: ~20 hours over 4 weeks, then ~6-8 hours/week ongoing for 12+ tests/month.
---
Phase 4: AI-Accelerated Results Analysis
Fast testing creates a new problem: analysis becomes the bottleneck. AI solves this too.
The Automated Analysis Prompt
```
Analyze this A/B test result and provide strategic recommendations:
Test Details:
- Hypothesis: [WHAT YOU TESTED]
- Variant A (control): [DESCRIPTION]
- Variant B: [DESCRIPTION]
- Primary metric: [METRIC]
- Secondary metrics: [LIST]
Results (after [X] days, [Y] visitors per variant):
- Variant A: [CONVERSION RATE]%, [SECONDARY METRICS]
- Variant B: [CONVERSION RATE]%, [SECONDARY METRICS]
- Statistical significance: [X%] (confidence level)
Provide:
1. Winner declaration (or "inconclusive - continue test")
2. Confidence assessment
3. Estimated impact if rolled out to 100% traffic
4. Explanation of why winner won (behavioral psychology)
5. Risks or concerns with the winner
6. Next test recommendations (3 follow-up ideas)
7. Rollout recommendation (full, partial, or abandon)
Format for stakeholder presentation.
```
AI Output Example
```
WINNER: Variant B (95% confidence)
Impact: +18% conversion rate improvement
ANALYSIS:
Variant B outperformed control with 2.54% conversion vs. 2.15% (18% relative improvement). With 8,400 visitors per variant over 6 days, we achieved 95% statistical significance.
WHY IT WORKED:
The outcome-focused CTA ("Get My Gear") reduced perceived purchase friction compared to transactional language ("Submit Order"). This aligns with psychological principle of positive framing—customers envision the benefit (receiving gear) rather than the cost (submitting payment).
RISKS:
- Improvement is headline-driven; rest of funnel unchanged
- May not hold for mobile traffic (71% of test traffic was desktop)
- Could be novelty effect; monitor for regression after 2 weeks
ESTIMATED ANNUAL IMPACT:
- Current: 420,000 annual visitors × 2.15% = 9,030 conversions
- With winner: 420,000 × 2.54% = 10,668 conversions
- Incremental: 1,638 conversions × $147 AOV = $240,786 additional revenue
NEXT TESTS:
1. Test variant B CTA on mobile specifically (address risk)
2. Apply outcome-focused language to other CTAs in funnel
3. Test even more specific outcome ("Get My Summit Pack")
ROLLOUT RECOMMENDATION:
Deploy to 100% of desktop traffic immediately. Run follow-up mobile-specific test simultaneously.
```
Time saved: What would take an analyst 2-3 hours is completed in 3 minutes.
Segmentation Analysis Prompts
The real power comes from analyzing segments:
```
Analyze these A/B test results broken down by segment:
[Paste segment data - traffic source, device, new vs. return, etc.]
Identify:
1. Which segments show strongest variant performance
2. Which segments show no difference or negative impact
3. Recommended rollout strategy by segment
4. Hypotheses for why segments differ
5. Next tests to validate segment learnings
```
This Reveals Hidden Insights
Example: Your test shows +5% overall lift, but segment analysis reveals:
- Mobile: +22% lift
- Desktop: -3% decline
- Recommendation: Deploy to mobile only, redesign desktop variant
Without segment analysis, you'd have rolled out a desktop-hurting change.
Multi-Test Portfolio Analysis
When running multiple simultaneous tests:
```
I'm running 5 concurrent A/B tests. Analyze the portfolio:
Test 1: [Details + results]
Test 2: [Details + results]
Test 3: [Details + results]
Test 4: [Details + results]
Test 5: [Details + results]
Provide:
1. Overall test portfolio health (are we learning?)
2. Common threads among winners
3. Strategic themes to pursue
4. Tests to kill early
5. Resource reallocation recommendations
6. Next quarter testing roadmap based on learnings
```
The Meta-Learning Loop
AI helps you learn not just from individual tests, but from patterns across your entire testing program. This is where velocity creates compounding advantage.
---
Phase 5: The 7-Day Sprint in Action
Let's walk through a complete sprint using the framework.
Case Study: DTC Supplement Brand
Context:
- Shopify store, 150K monthly visitors
- 2.8% conversion rate
- Product: Premium fitness supplements ($67 AOV)
- Main traffic: Facebook Ads + SEO
Day 1: Monday - Hypothesis Generation
Used AI prompt (30 minutes):
Generated 25 hypotheses across:
- Product page elements
- Cart optimization
- Checkout friction
- Email cart abandonment
- Trust signals
Scored with ICE framework (AI-assisted, 15 minutes):
Top 3 to test:
1. Add "subscribe and save 15%" option on product page (ICE: 8.7)
2. Show "X people viewing this product" social proof (ICE: 8.2)
3. Reduce checkout form fields from 12 to 7 (ICE: 7.9)
Day 2: Tuesday - Variant Creation
Morning (90 minutes):
- Used AI to generate 3 subscription messaging variants
- Created 4 social proof display variations
- Drafted simplified checkout form
Afternoon (45 minutes):
- Designer refined social proof mockups
- Reviewed checkout form with developer
Day 3: Wednesday - Implementation
Test 1 (Subscribe option): Implemented via Shopify app (30 minutes)
Test 2 (Social proof): Custom code by developer (2 hours)
Test 3 (Checkout): Modified checkout.liquid file (1.5 hours)
All tests live by 2pm Wednesday.
Days 4-6: Thursday-Saturday - Data Collection
Monitored via GA4 dashboard:
- Set up automated Slack alerts for anomalies
- Checked significance calculations daily
- No manual work required
Day 7: Sunday - Analysis
Used AI analysis prompt (45 minutes total):
Results:
- Test 1: +24% conversion on product page (Winner!)
- Test 2: +8% conversion, 90% significance (Promising, continue)
- Test 3: -2% conversion, 60% significance (Inconclusive, stop)
AI-generated analysis revealed:
- Subscribe option strongest for products >$50
- Social proof working but needs more data
- Checkout changes hurt mobile (form height issue)
Immediate Actions:
- Rolled out subscribe option to all products >$50
- Continued social proof test for 7 more days
- Killed checkout test, designed mobile-first alternative
Week 1 Impact:
- Revenue lift from subscribe option: +$18K/week
- Paid for entire year of testing program in one week
Experiment Tracking Table
Key Metrics Tracked:
- Conversion Rate: Primary success metric
- Statistical Confidence: Minimum 95% required to declare winner
- Relative Lift: Percentage improvement over control
- Absolute Lift: Percentage point difference
- Revenue Impact: Dollar value of improvement
- Secondary Metrics: Bounce rate, time on page, cart abandonment
Expanded Case Study: Week-by-Week Progression
Let's continue this DTC supplement brand case study through a full month to show compounding effects:
WEEK 2: Building on Winners
Monday: Generate New Hypotheses Based on Week 1 Learnings
AI prompt incorporating Week 1 insights: ``` Given these learnings:
- Subscription offer increased conversions +24%
- Social proof showing promising +8% lift
- Mobile checkout has specific friction (form height)
Generate 15 new hypotheses that:
- Expand subscription strategy to other pages
- Test different social proof formats
- Address mobile-specific friction points
- Explore complementary trust-building elements
Prioritize tests that build on proven winners. ```
Top 3 Tests Selected (30 minutes):
- Add subscription option to cart page (ICE: 9.2 - proven winner, new placement)
- Test social proof format: "Trusted by 15,000+ athletes" vs. "X viewing" (ICE: 8.5)
- Implement mobile-optimized single-page checkout (ICE: 8.1)
Tuesday-Wednesday: Rapid Implementation
Test 4: Cart page subscription - 45 minutes (extending existing module) Test 5: Social proof variant - 30 minutes (copy change only) Test 6: Mobile checkout redesign - 4 hours (new template)
All live by Wednesday afternoon.
Thursday-Sunday: Monitoring + Week 1 Test Completion
- Tests 4-6 collecting data
- Test 2 (social proof) reached 95% confidence: +9% lift confirmed, rolled out
- Revenue impact Week 2: +$23K (compounding with Week 1 winner)
WEEK 3: Expanding Testing Footprint
Results from Week 2 Tests (analyzed Monday morning):
Week 3 New Tests (building on momentum):
- Apply "Trusted by X athletes" to homepage hero
- Add "Subscribe and get free shipping" bundle offer
- Test product page layout: subscription option above fold
- Add "Most popular" badge to best-selling subscription option
Cumulative Impact After 3 Weeks:
- Baseline conversion rate: 2.8%
- Current conversion rate: 3.89% (+39% improvement)
- Additional weekly revenue: +$47K/week
- Three-week total revenue gain: $88K
- Testing program costs: $2,400 (tools + 20 hours of labor @ $75/hr)
- ROI: 3,567%
WEEK 4: Strategic Expansion
Pattern Recognition (AI-Generated Insight):
``` Analyzing 10 completed tests, key patterns emerged:
WINNING THEMES:
- Subscription messaging wins everywhere (+24% PDP, +31% cart, +15% in emails)
- Social proof with specific numbers outperforms generic claims (+12% lift)
- Mobile-specific optimization generates 2x desktop lift (18% vs 9%)
- Placement matters: cart page > PDP > homepage for subscription offers
STRATEGIC RECOMMENDATION: Focus next month on:
- Email flow optimization (subscription angle unexplored)
- Post-purchase upsells (subscription upgrade opportunity)
- Mobile user experience across entire funnel
- Expand social proof to low-traffic pages
PROJECTED IMPACT: If next 12 tests maintain 40% win rate with average 11% lift per winner:
- 5 additional winners expected
- Compounding effect: current 3.89% → 6.2% conversion rate
- Additional annual revenue: $890K vs. baseline ```
Month 1 Final Results:
Key Success Factors:
- Velocity compounds: Each winner creates platform for next test
- Learning accumulates: Pattern recognition improves hypothesis quality
- Confidence builds: Team sees quick wins, invests more in testing
- Process solidifies: By Week 4, testing becomes routine, not special project
- Executive support increases: ROI data makes testing budget untouchable
This is why AI-accelerated testing isn't just faster—it's fundamentally different. The learning loop operates at a pace where insights compound before market conditions change.
Week 2 Sprint:
Already queued based on Week 1 learnings:
- Test subscribe option on products under $50 (build on winner)
- Extend social proof test 7 more days (reach 95% confidence)
- Test mobile-first checkout design (fix identified issue)
---
Measuring ROI of Faster Testing
How do you quantify the value of 10x test velocity?
The Compounding Returns Model
Traditional testing (1 test/month):
- 12 tests per year
- Assume 33% winner rate (4 winners)
- Assume average winner: +8% conversion improvement
- Compounding effect: 1.08^4 = 36% cumulative improvement
AI-accelerated testing (1 test/week):
- 52 tests per year
- Assume same 33% winner rate (17 winners)
- Assume same +8% per winner
- Compounding effect: 1.08^17 = 272% cumulative improvement
Same win rate. Dramatically different outcomes.
Advanced ROI Modeling: Multi-Year Projections
Let's model the long-term financial impact with more granular assumptions:
Scenario Assumptions:
Year 1 Impact ($500K Baseline Annual Revenue):
Year 2 Impact (Compounding):
Year 3 Impact (Realistic Plateau):
At extreme conversion rates, diminishing returns kick in. Modeling assumes:
- Traditional: Continues linear growth (conversion optimization has headroom)
- AI-Accelerated: Hits market ceiling (~12-15% conversion rate for most DTC), shifts focus to AOV, LTV, retention
Critical Insights:
- Exponential divergence: The gap widens dramatically Year 2-3 due to compounding
- Investment efficiency: AI approach costs less ($75K vs $79K) while generating $7.47M more
- Plateau planning: Smart teams pivot focus as conversion rate optimization maxes out
- Risk mitigation: Even if AI-accelerated results are 50% overstated, still generates $3.7M more over 3 years
Sensitivity Analysis: What If Our Assumptions Are Wrong?
Even in the pessimistic scenario, AI-accelerated testing generates $2.22M more revenue over 3 years.
Calculate Your Testing ROI
Use this framework:
```
Input these numbers:
Current metrics:
- Monthly revenue: $X
- Current conversion rate: Y%
- Monthly marketing spend: $Z
Testing program:
- Tests per month: N
- Win rate: W%
- Average lift per winner: L%
- Cost per test (time + tools): $C
Calculate:
1. Annual testing cost: N × 12 × $C
2. Expected winners: N × 12 × W%
3. Cumulative conversion improvement: (1 + L%)^winners
4. Projected revenue impact: $X × 12 × (improvement - 1)
5. ROI: (Revenue impact - testing cost) / testing cost
```
Real Numbers Example
- Monthly revenue: $500K
- Current conversion: 3%
- Tests per month: 8 (AI-accelerated)
- Win rate: 30%
- Average lift: 7%
- Cost per test: $200 (mostly tool costs)
Calculation:
- Annual testing cost: $19,200
- Expected winners: 29
- Cumulative improvement: 1.07^29 = 650%
- Revenue impact: $6M × 5.5 = $33M additional
- ROI: 171,775%
Even if these numbers are off by 10x, it's still a phenomenal return.
Interactive ROI Calculator (Use This for Your Business)
Input your numbers into this framework:
``` YOUR BUSINESS METRICS: ───────────────────────────────────────────────── Monthly Revenue: $__________ Current Conversion Rate: % Average Order Value: $_ Monthly Visitors: __________ Monthly Marketing Spend: $__________
TESTING PROGRAM PARAMETERS: ───────────────────────────────────────────────── Tests Per Month: __________ (suggest 8-12 for AI-accelerated) Expected Win Rate: __________% (use 25-35%) Average Lift Per Winner: % (use 7-12%) Cost Per Test: $ (AI-accelerated: $200-500)
CALCULATED RESULTS: ─────────────────────────────────────────────────
-
Annual Testing Cost: [Tests/month] × 12 × [Cost/test] = $__________
-
Expected Winners Per Year: [Tests/month] × 12 × [Win rate] = __________ winners
-
Cumulative Conversion Rate Improvement: (1 + [Avg lift])^[Winners] - 1 = __________% total lift
-
New Conversion Rate: [Current CR] × (1 + [Total lift]) = __________%
-
Additional Annual Conversions: [Monthly visitors] × 12 × [CR increase] = __________
-
Additional Annual Revenue: [Additional conversions] × [AOV] = $__________
-
Net Benefit: [Additional revenue] - [Testing cost] = $__________
-
ROI: [Net benefit] / [Testing cost] = __________%
-
Payback Period: [Testing cost] / ([Additional revenue]/12) = __________ months ```
Example Calculation (Mid-Sized E-commerce):
``` YOUR BUSINESS: Monthly Revenue: $850,000 Current Conversion Rate: 2.8% Average Order Value: $125 Monthly Visitors: 243,000 Monthly Marketing Spend: $127,000
TESTING PROGRAM: Tests Per Month: 10 Expected Win Rate: 32% Average Lift Per Winner: 9% Cost Per Test: $350
RESULTS:
- Annual Testing Cost: $42,000
- Expected Winners: 38 winners
- Total Lift: 2,644% (26.44x improvement)
- New Conversion Rate: 74.03% (unrealistic, will plateau) Realistic plateau: ~12-15% for this industry
- Using realistic 12% plateau: Additional Annual Conversions: 268,560
- Additional Annual Revenue: $33,570,000 Realistic with plateau: ~$9,200,000
- Net Benefit: $9,158,000
- ROI: 21,710%
- Payback Period: 0.05 months (1.5 days) ```
Key Takeaways:
- Even conservative estimates show exceptional ROI: If actual results are 25% of projection, still generates $2.3M net benefit
- Payback is measured in days/weeks, not months/years: Testing programs are self-funding almost immediately
- Velocity creates option value: Fast testing lets you pivot quickly when tests fail, reducing sunk costs
- Compounding is non-linear: Most of the value comes from stacking multiple wins, not individual test performance
Common ROI Calculation Mistakes:
- Ignoring opportunity cost: Not testing costs more than failed tests
- Linear thinking: Assuming 4x tests = 4x results (it's exponential due to compounding)
- Attribution errors: Crediting testing for seasonal/market changes (use control groups)
- Forgetting time value: Revenue gained in Month 1 vs. Month 12 has different NPV
- Neglecting learning value: Failed tests generate insights that improve future win rates
---
Common Mistakes to Avoid
Fast testing creates new risks. Here's how to stay rigorous:
Mistake 1: Confusing Speed with Sloppiness
Wrong approach: "Let's just throw stuff up and see what works." Right approach: Speed in execution, rigor in methodology. Use AI to accelerate quality thinking, not replace it. How to avoid:
- Always state clear hypothesis before testing
- Define success metrics upfront
- Set significance thresholds (95%+ confidence)
- Document learnings even from failed tests
Mistake 2: Testing Without Sufficient Traffic
Wrong approach: Running 5 simultaneous tests on a site with 1,000 visitors/day.
Right approach: Calculate required sample size before launching using statistical formulas.
Sample Size Formula
For a two-tailed test:
n = (Z₁₋α/₂ + Z₁₋β)² × (p₁(1-p₁) + p₂(1-p₂)) / (p₂ - p₁)²

Where:
- n = sample size per variant
- Z₁₋α/₂ = Z-score for confidence level (1.96 for 95%)
- Z₁₋β = Z-score for statistical power (0.84 for 80%)
- p₁ = baseline conversion rate
- p₂ = expected improved conversion rate
Sample Size Requirements Table
Quick Rules of Thumb:
- Need 350-400 conversions per variant for 95% confidence
- If conversion rate is 2%, need 17,500-20,000 visitors per variant
- If you have 5,000 weekly visitors, run max 1-2 tests at a time
- Lower traffic sites should focus on higher-impact changes (bigger expected lifts)
Expanded Sample Size Analysis: Traffic-Specific Strategies
The most common reason testing programs fail isn't bad hypotheses—it's insufficient traffic for statistical rigor. Here's how to adapt your testing strategy based on your traffic volume:
LOW TRAFFIC SITES (Under 10,000 monthly visitors)
Strategic Approach for Low-Traffic Sites:
- Test big swings only: New pricing models, major product page redesigns, free trials vs. demos
- Use qualitative research first: 5-10 user interviews can identify high-probability tests
- Leverage industry benchmarks: Copy proven winners from similar businesses
- Consider sequential testing: Bayesian methods can reach conclusions faster (still need stats expertise)
- Focus on upper-funnel metrics: Test landing pages (higher traffic) before checkout (low traffic)
Sample Test Plan - Low Traffic Site:
Result: 4 high-impact tests per year, each carefully selected, vs. 40 low-confidence tests that teach you nothing.
MEDIUM TRAFFIC SITES (10,000-100,000 monthly visitors)
Traffic Allocation Strategy:
``` Total Monthly Traffic: 50,000 visitors Conversion Rate: 3% Monthly Conversions: 1,500
Funnel Stage Distribution: ├─ Homepage: 50,000 visitors (100%) ├─ Product Pages: 22,500 visitors (45%) ├─ Cart: 4,500 visitors (9%) └─ Checkout: 1,500 visitors (3%)
Simultaneous Test Capacity: ├─ Test 1: Homepage element (25,000 per variant) → 6-8 days to significance ├─ Test 2: Product page trust signals (11,250 per variant) → 10-14 days ├─ Test 3: Cart cross-sells (2,250 per variant) → 18-25 days └─ Optional Test 4: Email sequence (separate traffic source) → Parallel unlimited ```
Optimal Test Calendar (Medium Traffic):
Monthly Capacity: 8-12 tests with this approach (2-3 per funnel stage + 2-4 email tests)
HIGH TRAFFIC SITES (100,000+ monthly visitors)
Advanced Traffic Segmentation:
High-traffic sites can run ultra-granular tests:
``` Monthly Traffic: 400,000 visitors Segmentation Strategy:
Device Split: ├─ Mobile: 280,000 (70%) → Run 3-4 mobile-specific tests └─ Desktop: 120,000 (30%) → Run 2-3 desktop tests
Traffic Source Split: ├─ Organic: 160,000 (40%) → Run 2 tests ├─ Paid: 120,000 (30%) → Run 2 tests (may have different behavior) ├─ Email: 80,000 (20%) → Run 1-2 tests └─ Social: 40,000 (10%) → Run 1 test or group with paid
Funnel Stage Split: ├─ Homepage: Can handle 4-5 simultaneous micro-tests ├─ Category pages: 2-3 tests ├─ Product pages: 3-4 tests (different product categories) └─ Checkout: 2 tests (mobile vs desktop) ```
Weekly Test Capacity for High-Traffic Site: 15-25 active tests
Sample Size Calculator Prompt for AI:
``` Calculate required sample size for my A/B test:
Baseline conversion rate: [X%] Minimum detectable effect: [Y%] relative lift Significance level: 95% Statistical power: 80% Number of variants: 2 (A/B test)
Also calculate:
- How many days will this test take given [Z] daily visitors?
- How many simultaneous tests can I run given total traffic?
- What's the minimum detectable effect given my traffic constraints?
- Should I run this test sequentially or can I test in parallel?
Provide sample size formula, calculation, and recommendations. ```
AI Output Example:
``` INPUT PARAMETERS:
- Baseline conversion rate: 3.5%
- Minimum detectable effect: 15% relative lift (3.5% → 4.025%)
- Significance: 95% (Z = 1.96)
- Power: 80% (Z = 0.84)
- Variants: 2
CALCULATION: Using formula: n = (Z₁₋α/₂ + Z₁₋β)² × (p₁(1-p₁) + p₂(1-p₂)) / (p₂ - p₁)²
n = (1.96 + 0.84)² × (0.035(0.965) + 0.04025(0.95975)) / (0.04025 - 0.035)² n = 7.84 × 0.0723 / 0.0000275 n = 20,536 visitors per variant
RESULTS:
- Required sample size: 20,536 per variant (41,072 total)
- With 5,000 daily visitors split 50/50: 8.2 days to completion
- With your traffic, max simultaneous tests: 3-4 (assuming funnel segmentation)
- Minimum detectable effect at 7 days: 18% relative lift
- Recommendation: RUN TEST - traffic sufficient, reasonable timeline
CAPACITY ANALYSIS:
- Your 5,000 daily visitors = 35,000 weekly
- This test consumes: 41,072 visitors over 8 days
- Leaves: ~3,928 visitors for 1-2 other tests
- Optimal strategy: Run this + 1 smaller test on different funnel stage
RISK ASSESSMENT:
- If test runs 8 days but needs 10 for significance: extend test
- If early results show no movement at 50% sample: consider killing test
- Weekend traffic dips might extend test 1-2 days ```
Use AI to do sample size math for every test before launching.
Use AI to help:
```
Calculate sample size requirements:
Current conversion rate: [X%]
Minimum detectable effect: [Y%] (how small a lift you want to detect)
Significance level: 95%
Statistical power: 80%
Available traffic: [Z visitors/week]
Determine:
1. Required sample size per variant
2. Expected test duration
3. Maximum number of simultaneous tests given traffic
4. Whether test is feasible (or recommend sequential testing)
```
Mistake 3: P-Hacking and Premature Declarations
Wrong approach: Checking results every hour and calling winners at 80% significance when you're ahead. Right approach: Pre-define test duration or sample size. Check significance only at the end. How to avoid:
- Set calendar reminder for analysis date
- Use tools with automatic significance calculator
- If you must peek, use sequential testing methods (requires advanced stats)
Mistake 4: Ignoring Segment Differences
Wrong approach: Rolling out based on overall result without checking segments. Right approach: Always analyze by device, traffic source, new vs. return visitors.
Example AI prompt:
```
Before I roll out this test winner, what segment analyses should I check?
Test: [DESCRIPTION]
Segments available: Device, traffic source, new/return, geography
Overall result: +12% conversion (variant B)
Provide segment analysis checklist and potential risks if I skip it.
```
Mistake 5: Testing Trivial Changes
Wrong approach: Testing button color variations for 3 weeks. Right approach: Test meaningful changes that move strategic metrics. Priority hierarchy:
1. High: Structural/layout changes, value propositions, pricing/offers
2. Medium: Copy changes, imagery, trust signals
3. Low: Colors, fonts, button styles (test these last)
AI can help assess importance:
```
Evaluate this test idea:
Proposed test: [DESCRIPTION]
Effort: [TIME ESTIMATE]
Expected impact: [BEST GUESS]
Is this worth testing now, or should we prioritize other tests first? Suggest 3 higher-leverage alternatives if this isn't a priority.
```
---
Building a Testing Culture at Speed
Tools and frameworks mean nothing without organizational support.
Getting Executive Buy-In
The Pitch Structure
Use this AI prompt to build your business case:
```
Help me build a business case for accelerated testing:
Context:
- Company revenue: $X
- Current conversion rate: Y%
- Current testing velocity: Z tests/year
- Proposed velocity: N tests/year with AI
Create executive presentation including:
1. Current state vs. future state comparison
2. ROI calculation (show your work)
3. Required investment (tools + time)
4. Risk mitigation approach
5. 90-day pilot program structure
6. Success metrics
Tone: Confident, data-driven, acknowledges risks.
```
Team Training Program
Week 1: Foundation
- AI prompting basics (2 hours)
- Testing statistics refresher (1 hour)
- Tool stack training (3 hours)
Week 2: Practice
- Generate 50 hypotheses (exercise)
- Create variants for 3 tests (exercise)
- Implement and launch 1 test (hands-on)
Week 3: Production
- Each team member runs their own 7-day sprint
- Daily stand-ups to share learnings
- End-of-week analysis review
Documentation That Scales
Create a testing knowledge base:
Essential Pages:
1. Hypothesis Library: All ideas generated, tested or not
2. Test Results Database: Every test, winner or loser
3. Prompt Templates: Your best AI prompts for reuse
4. Playbook by Funnel Stage: Proven tests for each stage
5. Failed Test Insights: Why losers lost (often more valuable)
Use Notion or Airtable for easy AI integration:
```
Here's our test results database [paste data].
Analyze and create:
1. "Top 10 Learnings" summary page
2. "Next Quarter Test Roadmap" based on white space
3. "Segmentation Patterns" that emerged across tests
4. "ROI Dashboard" showing cumulative impact
Format for team knowledge base.
```
---
Advanced Tactics: Beyond the Basics
Once you've mastered the 7-day sprint, level up:
Sequential Testing for Continuous Learning
Instead of discrete A/B tests, run continuous optimization:
```
I'm running a sequential testing program for [ELEMENT].
Current version: [DESCRIPTION]
Goal: Continuously improve [METRIC]
Design a 12-week sequential testing roadmap where:
- Each test builds on learnings from previous
- We're always testing (no gaps)
- Variants get progressively more ambitious
- We can kill losers early and keep iterating
Provide week-by-week test plan.
```
Multi-Armed Bandit Testing
For higher traffic sites, use adaptive algorithms:
```
Explain how to set up multi-armed bandit testing for:
Scenario: [DESCRIPTION]
Traffic: [X visitors/day]
Current conversion: [Y%]
Tool: [VWO / Google Optimize / Custom]
Provide:
1. When to use MAB vs. traditional A/B
2. Setup instructions for [TOOL]
3. Interpretation guidelines (how to know when to commit)
4. Traps to avoid
```
Personalization + Testing
Combine AI testing with AI personalization:
```
I want to test personalized experiences:
Segments: [LIST]
Element to personalize: [PAGE / EMAIL / OFFER]
Personalization strategy: [BEHAVIORAL / DEMOGRAPHIC / PREDICTIVE]
Design a testing program where:
1. We test personalization vs. control
2. We test different personalization strategies
3. We measure incremental lift per segment
4. We avoid over-fragmenting traffic
Include measurement framework.
```
---
Your 30-Day Testing Transformation Plan
Ready to implement? Here's your roadmap:
Week 1: Foundation
- [ ] Audit current testing process (document time per step)
- [ ] Set up AI tools (Claude/ChatGPT account, save prompt templates)
- [ ] Inventory technical testing tools (identify gaps)
- [ ] Create testing database (Notion/Airtable)
- [ ] Run 1 AI-assisted hypothesis generation session
Week 2: First Sprint
- [ ] Use AI to generate 25+ hypotheses
- [ ] Score with ICE framework
- [ ] Create variants for top 3 tests
- [ ] Implement 1 test (your first 7-day sprint)
- [ ] Document process and time savings
Week 3: Scale to Portfolio
- [ ] Launch 3 simultaneous tests
- [ ] Set up monitoring dashboard
- [ ] Create analysis prompt templates
- [ ] Run your first AI-powered analysis
- [ ] Share results with stakeholders
Week 4: Systematize
- [ ] Document your testing playbook
- [ ] Train team on AI prompts
- [ ] Build test backlog (50+ ideas)
- [ ] Set up automated reporting
- [ ] Plan next month's test calendar
Month 2 Goal
Run 8-10 tests (your old quarterly volume in one month)
Month 3 Goal
Achieve 15+ tests/month with documented ROI
---
The Toolkit Checklist
Copy this into your testing stack:
AI Tools
- [ ] Claude or ChatGPT (for prompts)
- [ ] Notion AI or similar (for documentation)
Testing Platforms
- [ ] Site testing: Google Optimize / VWO / Convert
- [ ] Email testing: Klaviyo / Mailchimp built-in
- [ ] Landing pages: Unbounce / Instapage
Analytics
- [ ] Google Analytics 4
- [ ] Heatmaps: Hotjar / Microsoft Clarity
- [ ] Session recording: FullStory / Logrocket (optional)
Documentation
- [ ] Test database: Notion / Airtable
- [ ] Prompt library: Saved in preferred AI tool
- [ ] Results dashboard: Google Data Studio / Tableau
Automation
- [ ] Zapier / Make (for notifications)
- [ ] Slack (for team updates)
---
Conclusion: The Experimentation Advantage
The companies that win in the next decade won't be the ones with the biggest budgets or the most traffic. They'll be the ones who learn fastest.
AI has democratized experimentation velocity. What used to require a team of specialists can now be executed by a single growth marketer with the right workflows.
The barrier isn't tools or knowledge—it's mindset. You have to believe that testing fast is better than testing perfectly. You have to embrace small failures as the price of big wins. You have to build systems, not run one-off campaigns.
Start with one 7-day sprint. Use the prompts in this guide. Document what you learn. Then do it again.
In three months, you'll have run more tests than your competitors run in a year. In six months, you'll have a compounding advantage they can't catch.
The experimentation revolution is here. The only question is whether you'll lead it or watch from the sidelines.
---
Next in This Series
Part 3: The Ultimate Guide to AI-Powered Customer Research - How to extract insights from customer data 10x faster than traditional research methods. Part 4: AI Content That Actually Converts - Creating high-performing marketing content at scale without sacrificing quality. --- Want help implementing AI-accelerated testing for your business? WE•DO specializes in building experimentation engines that drive measurable growth. Schedule a strategy call to see how we can compress your testing cycle from months to days.
Ready to Transform Your Growth Strategy?
Let's discuss how AI-powered marketing can accelerate your results.