Somewhere along the way, A/B testing became synonymous with testing button colors. Red vs. green. "Buy Now" vs. "Add to Cart." These tests are easy to run, easy to understand, and almost always a waste of time.
Real conversion optimization isn't about incremental tweaks to design elements. It's about understanding user psychology, identifying conversion barriers, and running experiments that test genuine hypotheses. Here's how to make your testing program actually matter.
The Problem with Trivial Tests
Why do so many testing programs focus on trivial changes? Because they're safe. Testing button colors:
- Requires no research or hypothesis development
- Has low implementation cost
- Produces clear, simple results
- Can be run continuously
The problem? These tests rarely produce meaningful lifts. A 0.3% improvement in button click rate isn't going to transform your business. And if every test delivers marginal results, you'll eventually conclude that "testing doesn't work for us."
The Real Cost of Trivial Testing
Beyond wasted time, trivial tests have hidden costs that compound over time:
Organizational Impact of Trivial Testing
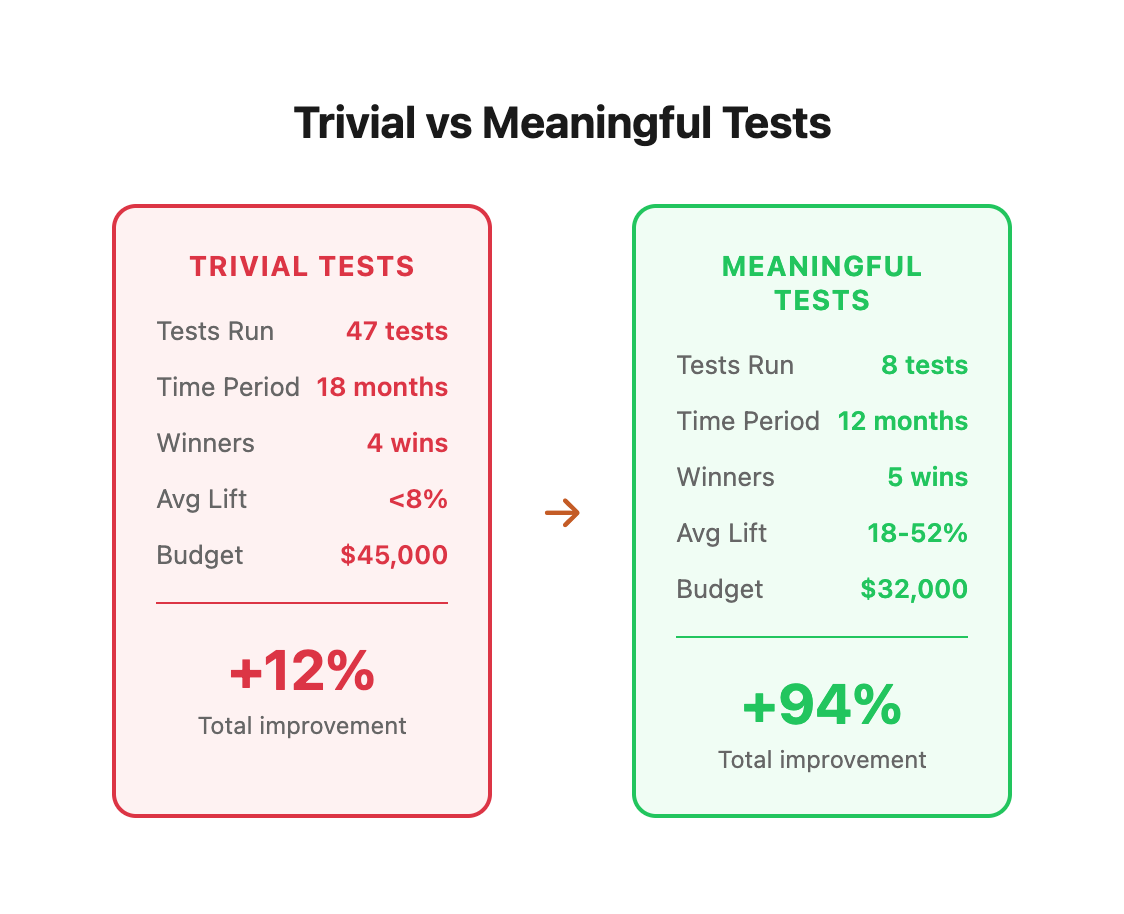
Real Example: SaaS Company Testing Trap
A B2B SaaS company we worked with had run 47 tests over 18 months:
- 43 tests on button colors, CTA copy variations, and form layouts
- 4 tests actually won (but all under 8% lift)
- Total compound impact: ~12% improvement
- Testing budget: $45,000
- Team hours invested: 380 hours
When we shifted their focus to meaningful tests:
- 8 tests over 12 months
- 5 tests won (lifts ranging from 18-52%)
- Total compound impact: 94% improvement
- Testing budget: $32,000
- Team hours invested: 240 hours
The difference? They stopped testing what was easy and started testing what mattered.
"The best testing programs we've seen run fewer tests, but those tests actually matter. One good test is worth a hundred trivial ones."
What Makes a Test Meaningful?
A meaningful test has these characteristics:
1. It's Based on a Real Hypothesis
Not "I wonder if green converts better than blue" but "We believe users abandon at checkout because they're unsure about shipping costs, and showing estimated delivery dates will reduce abandonment."
Hypothesis Structure Template:
IF we [CHANGE],
THEN [EXPECTED OUTCOME] will happen,
BECAUSE [REASONING BASED ON USER PSYCHOLOGY/DATA]
Example Hypotheses:
Real hypotheses come from:
- User research and customer interviews (qualitative insights)
- Analytics data showing friction points (quantitative evidence)
- Heatmaps and session recordings (behavioral observation)
- Customer support feedback (objection identification)
- Exit surveys and on-site polls (direct user voice)
The Research Framework for Building Hypotheses
Before you test anything, gather evidence from multiple sources. Here's a systematic approach:
Research Source Priority Matrix
Case Study: E-commerce Brand Hypothesis Development
Background: E-commerce store selling premium outdoor gear, 3.2% conversion rate, wanted to test product pages.
Research Process:
-
Analytics Review (Day 1):
- 42% of visitors viewed 3+ product images
- 28% scrolled to reviews section
- Only 8% clicked size guide
- Average time on page: 1m 47s
-
Session Recordings (Days 2-3):
- Watched 50 sessions of cart abandoners
- 31 users repeatedly clicked between product images and size chart
- 18 users added to cart, then returned to check dimensions
- Pattern: Size uncertainty drives hesitation
-
Exit Survey (Days 4-7):
- Asked non-buyers: "What stopped you from purchasing?"
- 44% selected "Not sure it will fit/work for my needs"
- 23% selected "Price too high"
- 18% selected "Need to research more"
-
Customer Interviews (Week 2):
- Called 12 recent customers
- Common theme: "I measured my current [product] before ordering"
- Insight: They need to visualize dimensions in context
Resulting Hypothesis:
IF we add an interactive "Size in Your Space" tool that shows product
dimensions overlaid on common reference objects (car trunk, doorway, etc.),
THEN conversion rate will increase by 25%+,
BECAUSE 44% of non-buyers cite fit uncertainty, session recordings show
repeated image-to-spec checking behavior, and customer interviews reveal
they measure existing items for comparison.
Test Result: 34% conversion lift, implemented permanently.
2. It Tests a Meaningful Difference
If users can't notice the difference between variations, the difference won't matter. Meaningful tests involve:
- Different value propositions
- Different page structures
- Different user flows
- Different pricing or offer structures
Test Impact Spectrum
Real Example: Page Structure Test
Company: B2B software company, $2M ARR, 1.8% trial signup rate
Control: Traditional long-form sales page
- Hero section with generic headline
- 5 feature sections (walls of text)
- Single CTA at bottom
- Testimonials buried at 70% scroll
- 12-minute average time on page
- 1.8% conversion rate
Variant: Problem-focused structure
- Hero: Customer's specific pain point (with data)
- "The Real Cost of [Problem]" calculator (interactive)
- 3 customer stories (video testimonials)
- Feature comparison table
- Multiple CTAs at friction points
- 6-minute average time on page
- 4.7% conversion rate
Result: 161% lift in signups. Why? Because the structure matched the buyer's mental journey, not the company's feature list.
3. It Could Fail
If you're 99% sure which variation will win, you're not learning anything. Good tests have genuine uncertainty—that's what makes them worth running.
The Learning Value Framework
The most valuable tests are the ones where your team is split 50/50 on which variation will win. That means you're testing at the edge of your understanding.
Real Example: Pricing Page Test That "Failed"
Company: SaaS startup, testing pricing transparency
Hypothesis:
IF we show full pricing upfront (instead of "Contact Sales"),
THEN qualified leads will increase by 30%+,
BECAUSE surveys show 73% of visitors want to see pricing before talking to sales.
Team Confidence: 85% thought transparency would win
Result: 22% decrease in qualified leads
Why It Failed:
- Follow-up interviews revealed high-intent buyers actually preferred sales calls
- "Contact Sales" button filtered out low-budget shoppers
- Showing pricing attracted more tire-kickers who filled forms but never bought
- The company was selling $50K+ contracts, not self-serve SaaS
Learning Value: Massive. Changed entire go-to-market strategy to focus on high-touch sales. Saved 6 months of building self-serve infrastructure they didn't need.
4. The Result Will Change Behavior
Before running any test, ask: "What will we do differently based on the result?" If the answer is "nothing much," don't run the test.
Decision Impact Matrix
Tests Worth Running
Here are the categories of tests that actually move the needle:
Value Proposition Tests
How you communicate your value is more important than how you style it. Test different angles:
- Lead with features vs. lead with benefits
- Rational arguments vs. emotional appeals
- Problem-focused vs. solution-focused messaging
Value Proposition Testing Framework
Real Test: B2B Software Homepage
Control (Feature-Led): Headline: "Enterprise Resource Planning for Modern Teams" Subhead: "Cloud-based ERP with AI-powered insights, real-time reporting, and 200+ integrations" Result: 2.3% trial signup rate
Variant A (Problem-Led): Headline: "Still Managing Inventory in Spreadsheets?" Subhead: "Manufacturing teams waste 14 hours per week on manual data entry. We automate it." Result: 5.1% trial signup rate (122% lift)
Variant B (Transformation-Led): Headline: "From 3-Day Reporting to Real-Time Insights" Subhead: "See exactly what's happening in your operation, right now" Result: 4.4% trial signup rate (91% lift)
Winner: Problem-Led. Why? The target market (small manufacturers) had acute pain and didn't even know modern solutions existed. They needed the problem called out explicitly.
Social Proof Tests
How you demonstrate credibility matters. Test different approaches:
- Customer testimonials vs. usage statistics
- Expert endorsements vs. peer reviews
- Prominent vs. subtle placement
Social Proof Effectiveness by Industry
Social Proof Hierarchy Framework
1. Specific Results (Highest Impact)
   "Sarah increased revenue 340% in 90 days"
   ↓
2. Named Testimonials with Photos
   Real person, real story, real face
   ↓
3. Usage Statistics
   "Join 50,000+ companies"
   ↓
4. Brand Logos (Lowest Impact)
   Generic logo wall
Real Test: SaaS Pricing Page Social Proof
Control:
- Generic testimonial: "Great product! - John S."
- Placed in sidebar
- No context or results
- 4.2% conversion rate
Variant:
- Specific result: "We cut support tickets by 67% in the first month. The ROI was immediate." - Jennifer Martinez, Director of Customer Success, TechCorp (Series B, 200 employees)
- Placed directly above pricing table
- Included company size/stage context
- 6.8% conversion rate (62% lift)
Key Insight: Specificity + relevance + placement = compounding effects
Friction Reduction Tests
Every step in your funnel loses people. Test removing friction:
- Single-page vs. multi-step checkout
- Guest checkout vs. required registration
- Form field reduction
Friction Audit Framework
Friction Calculation Formula
Friction Score = (Steps × Complexity) + (Fields × Difficulty) + Uncertainty

Where:
- Steps = Number of distinct actions required
- Complexity = Technical difficulty (1-10 scale)
- Fields = Number of form inputs
- Difficulty = Cognitive load per field (1-5 scale)
- Uncertainty = Unknown outcomes (0-20 penalty)

Example:
Traditional Checkout: (4 steps × 3) + (12 fields × 2) + 15 = 51
Optimized Checkout: (1 step × 1) + (5 fields × 1) + 5 = 11

Friction Reduction: 78%
Real Test: E-commerce Checkout Friction
Control (Multi-Step):
- Step 1: Account creation (5 fields)
- Step 2: Shipping address (7 fields)
- Step 3: Payment method (8 fields)
- Step 4: Review order
- Completion rate: 34%
Variant A (Single-Page):
- All fields on one page (20 fields visible)
- Guest checkout option at top
- Completion rate: 41% (21% lift)
Variant B (Progressive Disclosure):
- Start with email only
- Shipping fields appear after email
- Payment appears after shipping validated
- Auto-fills data where possible
- Completion rate: 52% (53% lift)
Winner: Progressive Disclosure. Why? It reduced perceived friction while maintaining single-page flow.
Field-Level Friction Analysis
Offer Structure Tests
How you present your offer can matter more than the offer itself:
- Pricing presentation and anchoring
- Bundle configurations
- Guarantee framing
Pricing Psychology Framework
Real Test: SaaS Pricing Page Structure
Control (3-Tier Traditional):
Starter: $29/mo
Professional: $79/mo
Enterprise: $199/mo
Distribution: 45% Starter, 35% Pro, 20% Enterprise ACV: $94/customer
Variant (Anchored with Decoy):
Basic: $29/mo (limited features, no support)
Professional: $79/mo [MOST POPULAR] (all features, email support)
Business: $149/mo (all Pro + dedicated support + API)
Enterprise: $299/mo (custom everything)
Distribution: 12% Basic, 61% Professional, 22% Business, 5% Enterprise ACV: $128/customer (36% increase)
Key Changes:
- Added "Basic" tier as lower anchor (makes $79 feel reasonable)
- Labeled middle tier "Most Popular" (social proof)
- Created clear differentiation between tiers
- Made "Business" tier obviously better value than old Enterprise
Guarantee Framing Test
Control: "30-day money-back guarantee" Conversion rate: 3.8%
Variant A: "Try it free for 30 days. If you don't see results, we'll refund every penny." Conversion rate: 4.9% (29% lift)
Variant B: "60-day results guarantee: If you don't [specific outcome], get a full refund + $50 for your time" Conversion rate: 5.7% (50% lift)
Why B Won: It removed risk AND demonstrated confidence in results. The $50 bonus showed they actually stand behind the promise.
Running Better Tests
Start with Research
Never run a test without understanding why. Spend time on qualitative research before you spend resources on testing. Talk to customers. Review session recordings. Understand the problem before testing solutions.
Research Time Allocation Guidelines
Rule of Thumb: Spend 3-5x more time on research than test implementation. A well-researched test will outperform 10 random tests.
The 5-Interview Rule
After conducting hundreds of customer interviews, we've found a pattern: You'll discover 80% of your most valuable insights in the first 5 interviews.
Interview Response Pattern:
Stop at 5 unless: You're seeing completely new themes, or you have distinct customer segments that need separate analysis.
Calculate Sample Size First
Know how long you'll need to run before you start. If you don't have enough traffic to reach significance in a reasonable timeframe, either don't run the test or test something with bigger expected impact.
Statistical Significance Calculator
Z-score = (p₂ - p₁) / √[(p₁(1-p₁)/n₁) + (p₂(1-p₂)/n₂)]

Where:
- p₁ = control conversion rate
- p₂ = variant conversion rate
- n₁ = control sample size
- n₂ = variant sample size

If Z-score > 1.96, result is significant at 95% confidence
If Z-score > 2.58, result is significant at 99% confidence
Significance Thresholds Table
Example Calculation:
Test: Product page headline change
- Control: 2,150 visitors, 86 conversions (4.0%)
- Variant: 2,150 visitors, 112 conversions (5.2%)
Z = (0.052 - 0.040) / √[(0.040×0.960/2150) + (0.052×0.948/2150)]
Z = 0.012 / √[0.0000179 + 0.0000229]
Z = 0.012 / 0.00639
Z = 1.88
Result: 93.9% confidence (below 95% threshold - continue test)
Sample Size Requirements by Baseline Conversion Rate
Traffic Requirements Calculator
Days Required = (Sample Size × 2) / (Daily Traffic × Test Allocation %)

Example:
Need 7,600 per variation (15,200 total)
Daily traffic: 500 visitors
Test allocation: 80% (400 visitors in test)
Days = 15,200 / 400 = 38 days

Reality: Need ~6 weeks to reach significance
When You Don't Have Enough Traffic:
Run Fewer, Better Tests
A testing program that runs 50 trivial tests per year will be outperformed by one that runs 10 meaningful tests. Quality over quantity.
Test Impact Comparison
Why Meaningful Tests Win:
- Larger absolute lifts compound faster
- Higher confidence in results (less noise)
- Deeper learnings inform future tests
- Team morale improves with clear wins
The Compounding Effect Explained
When you run a test and implement the winner, you're not just getting that single lift—you're raising the baseline for all future tests. This is where meaningful tests dramatically outperform trivial ones.
12-Month Compounding Comparison
Meaningful tests win by 10% despite running 80% fewer tests.
Document Everything
The value of testing compounds when you learn from past results. Document hypotheses, results, and learnings. Build an institutional knowledge base.
Test Documentation Template
\# Test Name: [Descriptive Name]
**Date:** YYYY-MM-DD to YYYY-MM-DD
**Page/Flow:** [URL or Flow Name]
**Status:** [Running | Won | Lost | No Difference | Inconclusive]

## Hypothesis
IF we [change],
THEN [outcome] will happen,
BECAUSE [reasoning with data source]

## Research Evidence
- Analytics: [key findings]
- Recordings: [behavioral patterns]
- Surveys: [objection data]
- Interviews: [psychological insights]

## Test Details
- **Control:** [description + screenshot]
- **Variant:** [description + screenshot]
- **Traffic Split:** 50/50
- **Duration:** X days
- **Sample Size:** X per variation

## Results

| Metric | Control | Variant | Change | Confidence |
|--------|---------|---------|--------|------------|
| Primary | X% | X% | +X% | 95%+ |
| Secondary | X% | X% | +X% | 95%+ |

## Learnings
1. [Key insight from test]
2. [Unexpected finding]
3. [Implication for future tests]

## Next Steps
- [ ] Implement winner
- [ ] Test adjacent hypothesis
- [ ] Apply pattern to [other pages]
Test Knowledge Base Structure
/testing-program
  /hypotheses
    /backlog.md (prioritized test ideas)
    /rejected.md (ideas we decided not to test and why)
  /tests
    /2024-01-homepage-value-prop.md
    /2024-02-pricing-anchor.md
    /2024-03-checkout-friction.md
  /patterns
    /winning-patterns.md (reusable insights)
    /losing-patterns.md (what doesn't work)
  /insights
    /customer-psychology.md (deep insights from interviews)
    /friction-map.md (known friction points across site)
The Real Goal
The goal of A/B testing isn't to produce winning tests—it's to produce learning. Sometimes a "losing" test teaches you more than a "winning" one.
The best testing programs create a culture of experimentation where decisions are informed by data, hypotheses are constantly generated and tested, and the organization gets smarter over time.
Learning vs. Winning Mindset
The Most Valuable "Losing" Tests
Sometimes tests that lose teach you more than tests that win. Here are real examples:
Case 1: Social Proof Backfire
Test: Added "Join 50,000+ users" badge to SaaS homepage Expected: 20%+ lift (social proof always works, right?) Result: 18% decrease in signups Learning: The product was positioning as "exclusive" and "enterprise." Large user count made it seem commodity/consumer. Changed messaging to "Trusted by 200+ enterprise companies" and got 32% lift.
Case 2: Friction That Converts
Test: Removed phone number field from lead form (friction reduction) Expected: 30%+ increase in leads Result: 47% increase in leads, but 68% decrease in sales-qualified leads Learning: Phone field was actually qualifying leads. People willing to give phone number were serious buyers. Kept phone field, improved overall funnel efficiency.
Case 3: Price Transparency Disaster
Test: Show pricing upfront instead of "Request Demo" Expected: 25%+ increase in qualified leads Result: 41% decrease in demos booked Learning: High-ticket B2B buyers (>$50K contracts) actually prefer sales conversations. They want custom solutions, not off-the-shelf pricing. Reverted and focused on improving demo process instead.
The Documentation Payoff
Companies that document tests systematically see:
Ready to Run Tests That Matter?
If your testing program has stalled or you're not seeing meaningful results, let's talk. Our CRO & Analytics team will help you identify the tests that will actually move your business forward.
What You'll Get:
- Conversion Audit - We'll review your funnel and identify the highest-impact friction points
- Research Roadmap - A prioritized list of hypotheses worth testing based on your data
- Testing Strategy - A 90-day experimentation plan focused on meaningful lifts
- Implementation Support - Help running tests, analyzing results, and applying learnings
Stop testing button colors. Start testing what matters.