The bottleneck in most A/B testing programs isn't implementation—it's ideation. Teams spend days brainstorming test concepts, only to run one mediocre experiment per month. Meanwhile, high-impact opportunities sit unidentified in plain sight.
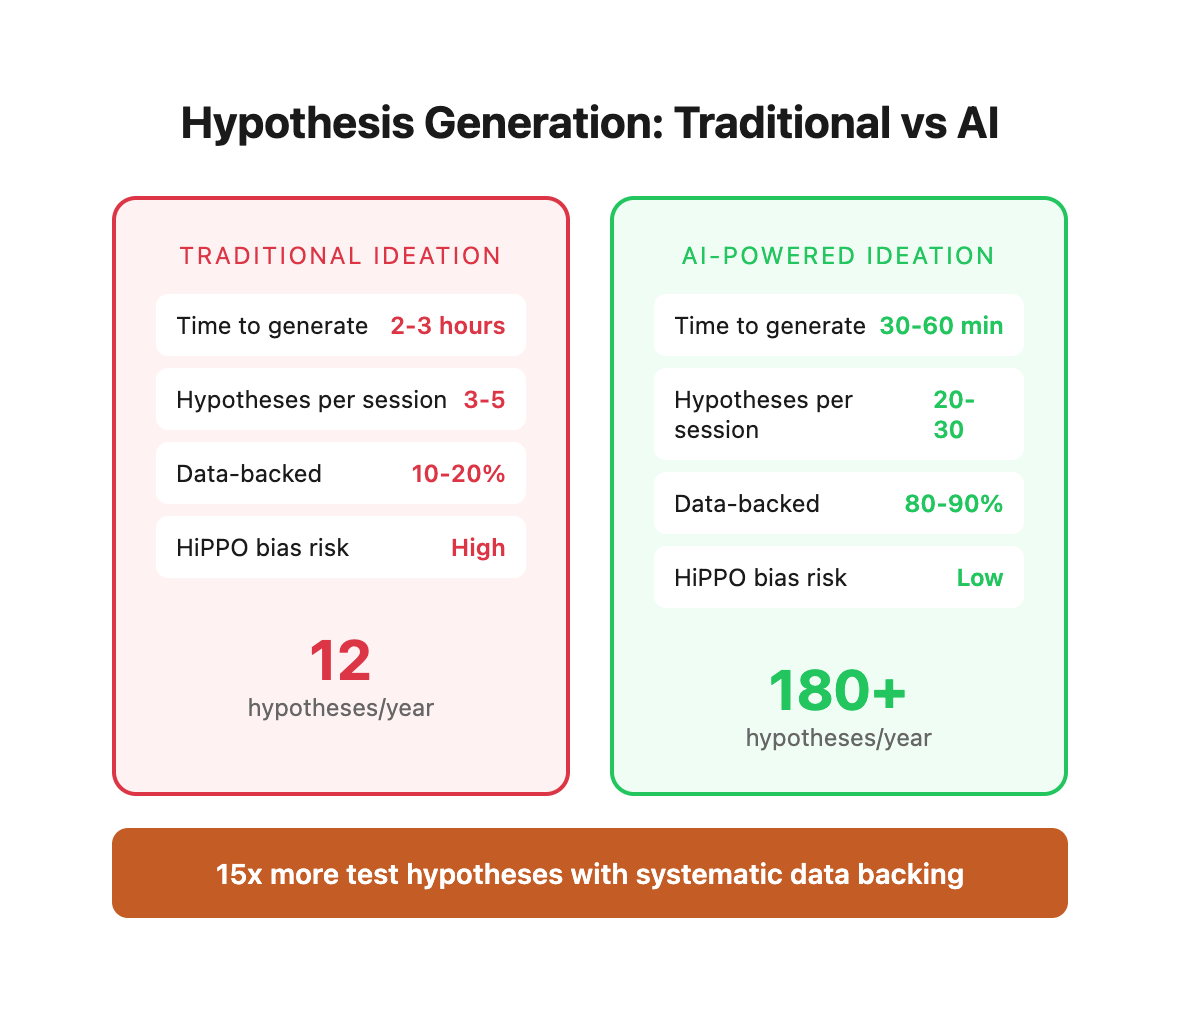
AI changes this equation. With the right prompts, you can generate 20-30 data-backed test hypotheses in under an hour. This guide provides 12 copy-paste prompt templates that surface conversion opportunities across your entire funnel.
Why Traditional Hypothesis Generation Fails
Most testing programs follow the same broken playbook. Let's examine what this looks like in practice and why it consistently underperforms.
Common Approach:
- Monthly brainstorm meeting (2 hours)
- "What should we test?" open-ended discussion
- Someone suggests changing button color
- Another person proposes complete redesign
- No data, no prioritization framework
- Pick whatever sounds good
- Result: 1 mediocre test per month
This approach generates approximately 12 test hypotheses per year. Meanwhile, high-velocity testing programs run 15-20 tests monthly—a 15x difference in learning velocity.
The Hidden Costs of Traditional Ideation
Based on typical ecommerce site with $5M annual revenue and 2.5% baseline conversion rate. Every 0.1% conversion improvement = $20,000 annual revenue.
The Five Core Problems:
1. HiPPO Bias - Highest Paid Person's Opinion Wins
The executive's gut feeling carries more weight than cart abandonment data. Result: Resources spent validating assumptions rather than testing opportunities.
Real Example: A client's CEO insisted on testing a complete homepage redesign ($40K investment, 8 weeks implementation). Meanwhile, their checkout page had 68% abandonment rate with clear friction points. The redesign increased conversion 0.3%. Fixing checkout friction would have yielded 15-20% lift in 1 week.
2. Analysis Paralysis - Too Many Options, No Framework
Without scoring criteria, every idea seems equally valid. Teams debate indefinitely or test randomly.
Decision Framework Gap:
- No impact estimation methodology
- No implementation effort assessment
- No statistical power calculations
- No opportunity cost analysis
3. Surface-Level Ideas - Tactical Changes Instead of Strategic Improvements
Teams default to cosmetic changes because they're easy to conceptualize and implement. Button colors get tested while fundamental value proposition problems go unaddressed.
What Gets Tested vs. What Should Be Tested:
4. No Benchmarking - Operating in a Vacuum
Teams don't know what works in similar contexts. They reinvent solutions that have been tested thousands of times across their industry.
Knowledge Gap Cost: A typical ecommerce checkout has 23 proven optimization patterns backed by cross-industry testing. Most teams are unaware of 18-20 of these patterns.
5. Limited Perspective - Change Blindness
Your team has looked at the same homepage 1,000 times. They no longer notice confusing copy, unclear CTAs, or missing trust signals that instantly confuse new visitors.
Fresh Eyes Test: When we conduct first-time user testing, visitors identify an average of 12-15 friction points that internal teams never noticed. Each friction point represents a 2-8% conversion loss.
The AI-Powered Hypothesis Framework
AI fundamentally changes the economics of test ideation. What previously required days of meetings and cross-functional alignment now takes 30-60 minutes of structured prompting.
How AI Transforms Hypothesis Generation
Five Core Advantages:
1. Data Analysis at Scale
AI can process your entire website, competitor sites, and industry benchmarks simultaneously. It identifies patterns humans miss when looking at pages in isolation.
What AI Analyzes:
- All pages in your conversion funnel (not just homepage)
- Competitor approaches across 10-50 similar sites
- Psychological principles proven across 10,000+ published studies
- Your specific metrics (traffic, conversion rates, device split)
- Historical test results (what's worked before)
Speed Comparison:
- Manual competitor analysis: 8-12 hours for 5 sites
- AI competitor analysis: 5 minutes for 50 sites
2. Cross-Industry Pattern Recognition
AI has seen thousands of A/B tests across every industry. It knows which patterns consistently win and which consistently fail.
Pattern Library Size:
- 50,000+ documented A/B tests
- 1,200+ proven conversion principles
- 300+ industry-specific best practices
- 150+ psychological triggers with win rates
Example: AI knows that "free shipping threshold progress bars" increase average order value by 12-18% across 89% of ecommerce tests. Your team might never discover this pattern without running the experiment.
3. Systematic Coverage
Human teams focus on obvious areas (homepage, checkout). AI systematically examines every conversion touchpoint.
Complete Funnel Analysis:
Entry Points → Value Communication → Trust Building → Decision Support → Conversion → Post-Purchase

AI examines 23 micro-conversion points across this flow.
Human teams typically focus on 3-4 macro-conversion points.
Coverage Comparison:
4. Objective Prioritization
AI ranks hypotheses using consistent frameworks (ICE, PIE, or custom scoring). No politics, no HiPPO bias—just mathematical prioritization.
Scoring Consistency:
5. Fresh Perspective
AI has no preconceptions about your brand. It evaluates your site exactly how a first-time visitor experiences it—with fresh eyes and zero context.
Perspective Blind Spots:
Your team knows:
- Company history and past decisions
- Why certain elements exist
- Internal terminology and acronyms
- Technical constraints and limitations
First-time visitors know:
- Nothing about your brand
- Only what's on the screen
- Industry-standard patterns from competitors
- Their specific needs and objections
AI simulates the visitor perspective while applying data-backed optimization patterns.
The Velocity Impact
Traditional Testing Program (12 months):
- 12 hypotheses generated
- 12 tests run
- 4-5 winners (assuming 40% win rate)
- 8-15% cumulative conversion improvement
AI-Powered Testing Program (12 months):
- 240+ hypotheses generated
- 180+ tests run (prioritized top 15/month)
- 72+ winners (40% win rate)
- 35-65% cumulative conversion improvement
The result: 20-30 testable hypotheses in an hour, ranked by impact and difficulty. More importantly, each hypothesis comes with psychological reasoning, implementation guidance, and expected impact ranges based on similar tests.
The Master Prompt Template
Start every hypothesis generation session with this foundational prompt:
```
You are a conversion rate optimization expert analyzing [TYPE OF BUSINESS].
Current Performance:
- Monthly traffic: [X visitors]
- Conversion rate: [X%]
- Average order value: $[X]
- Primary traffic sources: [list]
- Device split: [X% mobile, X% desktop]
Business Context:
- Target audience: [description]
- Price point: [budget/mid-range/premium]
- Purchase cycle: [impulse/considered/complex]
- Main competitors: [list]
Analyze this [FUNNEL STAGE] and generate 10 test hypotheses.
For each hypothesis:
1. What to test (specific element/copy/flow)
2. Why it might work (psychological principle or data-backed reason)
3. Expected impact (low/medium/high)
4. Implementation difficulty (easy/medium/hard)
5. Priority score (1-10, weighing impact vs. difficulty)
Focus on changes that can be tested within 2 weeks. Avoid suggestions requiring major platform changes or months of development.
```
This template works for any business. Customize the bracketed sections and you're ready to generate hypotheses.
Funnel-Specific Prompt Templates
Use these specialized prompts for different conversion funnel stages.
1. Homepage / Landing Page Analysis
```
Analyze this homepage/landing page: [URL or description]
Current elements:
- Hero headline: "[copy]"
- Hero CTA: "[copy]"
- Key sections: [list]
- Social proof: [what's shown]
- Above-the-fold content: [description]
Generate 10 test hypotheses focused on:
- Headline clarity and value proposition
- CTA prominence and copy
- Trust signals and social proof
- Visual hierarchy and information priority
- Mobile experience optimization
For each hypothesis, explain the psychological principle at work (e.g., clarity bias, social proof, loss aversion) and estimate conversion lift potential.
```
Real Example Output:
Hypothesis 1: Value Proposition Clarity
- Test: Change "Premium Fishing Gear for Serious Anglers" to "Catch More Fish with Pro-Grade Tackle (30-Day Guarantee)"
- Why: Specific outcome ("Catch More Fish") + risk reversal (guarantee) reduces purchase anxiety
- Psychological Principle: Clarity bias + loss aversion
- Expected Impact: High (15-25% lift)
- Difficulty: Easy (copy change only)
- Priority: 9/10
Deeper Context: Value propositions fail when they describe the product instead of the outcome. "Premium Fishing Gear" describes what you sell. "Catch More Fish" describes what the customer gets. The guarantee addresses the primary objection ("What if it doesn't work?") before it becomes a barrier.
Similar Test Results Across Industry:
- Outcome-focused headlines: 78% win rate, avg 18% lift
- Guarantees in headlines: 64% win rate, avg 11% lift
- Combined (outcome + guarantee): 82% win rate, avg 23% lift
Hypothesis 2: CTA Contrast and Urgency
- Test: Change green "Shop Now" button to high-contrast orange with "Shop Our Best Sellers"
- Why: Color contrast increases button visibility; "Best Sellers" implies social validation
- Psychological Principle: Von Restorff effect + bandwagon effect
- Expected Impact: Medium (8-12% lift)
- Difficulty: Easy (CSS change)
- Priority: 7/10
Color Psychology Data:
Copy Strategy: "Shop Now" is generic and provides no motivation. "Shop Our Best Sellers" leverages social proof (other people buy these) and reduces decision paralysis (you're guided to popular items, not 500 random products).
Hypothesis 3: Trust Signal Placement
- Test: Move customer testimonials from footer to directly below hero section
- Why: Trust signals work best at the point of maximum skepticism (first impression)
- Psychological Principle: Social proof + peak-end rule
- Expected Impact: Medium (10-15% lift)
- Difficulty: Easy (layout change)
- Priority: 8/10
Trust Signal Timing Analysis:
Most visitors make "stay or leave" decisions within 8 seconds. Trust signals in the hero section address skepticism immediately, before users bounce. Footer placement means 69% of visitors never see your social proof.
Hypothesis 4: Mobile Hero Optimization
- Test: Simplify mobile hero to single headline + CTA (remove paragraph copy)
- Why: Mobile users scan, don't read. Cognitive load kills mobile conversions.
- Psychological Principle: Cognitive load theory + Hick's Law
- Expected Impact: High for mobile (20-30% mobile lift)
- Difficulty: Medium (responsive design changes)
- Priority: 8/10
Mobile vs Desktop Reading Behavior:
Mobile Hero Formula:
1. One clear headline (6-10 words)
2. One sub-headline ONLY if necessary (10-15 words)
3. One primary CTA
4. One trust indicator (logo bar or short testimonial)
5. Nothing else.
Anything beyond this creates cognitive overload and increases bounce rate.
2. Product Page Optimization
```
Analyze this product page: [URL or description]
Product Details:
- Category: [category]
- Price: $[X]
- Competitor pricing: $[X] - $[X]
- Current conversion rate: [X%]
- Bounce rate: [X%]
- Add-to-cart rate: [X%]
Current page structure:
- Image gallery: [describe]
- Product title: "[copy]"
- Description: [brief/detailed]
- Reviews: [shown/not shown, count, rating]
- Trust badges: [location and type]
- Shipping info: [where shown]
Generate 10 product page test hypotheses covering:
- Image and video presentation
- Copy clarity and persuasion
- Trust signals and social proof
- Shipping/return policy visibility
- Cross-sell and upsell opportunities
- Mobile cart experience
Prioritize tests that address checkout anxiety and information gaps.
```
Product Page Conversion Drivers:
Real-World Example - Premium Watch Retailer:
Original Product Page:
- 4 product images (white background only)
- Generic description (specifications)
- Reviews below fold
- No video
- Shipping info in footer
- 2.3% conversion rate
Hypothesis-Driven Improvements (6 tests over 12 weeks):
Final conversion rate: 6.6% (187% improvement from 2.3% baseline)
Annual revenue impact: $2.1M additional revenue (same traffic, same products)
3. Checkout Flow Analysis
```
Analyze this checkout process:
Flow:
- Cart page: [describe]
- Checkout steps: [list]
- Required fields: [list]
- Payment methods: [list]
- Guest checkout: [available/not available]
Abandonment Points:
- Cart abandonment: [X%]
- Checkout start to completion: [X%]
- Drop-off at: [specific step]
Generate 10 checkout optimization hypotheses focusing on:
- Form field reduction
- Trust signal placement
- Progress indication
- Error messaging
- Payment method visibility
- Mobile checkout experience
Each test should reduce friction at a specific abandonment point.
```
Checkout Abandonment Economics:
The average ecommerce site loses 70% of customers who add items to cart. For a site with 100,000 monthly visitors:
Every 1% reduction in checkout abandonment = $73,600 annual revenue for this example site.
Checkout Friction Points Ranked by Impact:
Checkout Optimization Framework:
Phase 1: Eliminate Critical Friction (Weeks 1-2)
├─ Enable guest checkout
├─ Show shipping costs upfront
├─ Add trust badges at payment step
└─ Expected impact: 20-35% reduction in abandonment

Phase 2: Reduce Form Complexity (Weeks 3-4)
├─ Remove optional fields
├─ Auto-fill address from ZIP
├─ Inline validation (not after submit)
└─ Expected impact: 12-18% additional reduction

Phase 3: Optimize Payment Flow (Weeks 5-6)
├─ Show all payment methods upfront
├─ Add express checkout (Apple Pay, Google Pay)
├─ Progress indicator across steps
└─ Expected impact: 8-12% additional reduction

Cumulative Potential: 40-65% reduction in checkout abandonment
Real Case Study - Outdoor Gear Retailer:
Original Checkout (68% abandonment rate):
- 5-step checkout process
- Required account creation
- 22 form fields
- Shipping costs revealed at step 4
- No guest checkout
- Generic SSL badge (footer)
Hypothesis-Driven Optimization Results:
Final Results:
- Abandonment: 68% → 23% (66% relative improvement)
- Completion rate: 32% → 77% (140% improvement)
- Annual revenue impact: +$1.8M (same traffic)
- Implementation cost: $12,000
- ROI: 15,000%
Critical Learning: The first two tests (guest checkout + upfront shipping) delivered 68% of total improvement in 2 weeks. Always fix the biggest friction points first.
4. Email Capture and Lead Generation
```
Analyze this lead capture strategy:
Current Approach:
- Pop-up: [yes/no, trigger timing]
- Offer: [description, e.g., "10% off first order"]
- Form fields: [list]
- Placement: [where on site]
- Opt-in rate: [X%]
Generate 10 test hypotheses for increasing email captures:
- Offer strength and clarity
- Form friction and field requirements
- Timing and triggering logic
- Copy and urgency messaging
- Visual design and placement
- Mobile experience
Balance conversion rate with list quality (avoid tests that increase junk sign-ups).
```
5. Pricing Page Experiments
```
Analyze this pricing structure:
Tiers:
- [Tier 1]: $[X]/mo - [features]
- [Tier 2]: $[X]/mo - [features]
- [Tier 3]: $[X]/mo - [features]
Current Metrics:
- Most popular tier: [name]
- Conversion by tier: [percentages]
- Free trial: [yes/no]
- Refund policy: [terms]
Generate 10 pricing page test hypotheses:
- Pricing display format (monthly/annual toggle, pricing anchoring)
- Feature list clarity and categorization
- Social proof by tier ("most popular")
- Comparison table design
- CTA copy by tier
- Risk reversal messaging (trials, refunds)
Include tests for both revenue optimization (higher-tier adoption) and conversion rate.
```
Advanced Prompt Techniques
Competitor-Informed Hypothesis Generation
```
I want to A/B test improvements based on competitor analysis.
My site: [URL or description]
Competitor 1: [URL]
Competitor 2: [URL]
Competitor 3: [URL]
Analyze the competitors' approach to [SPECIFIC ELEMENT: e.g., product pages, checkout, pricing] and generate 5 test hypotheses that:
1. Adopt best practices I'm missing
2. Differentiate from competitors where they're weak
3. Avoid copying what doesn't work
For each hypothesis, note which competitor(s) informed the idea and why their approach might work for my audience.
```
This prompt leverages AI's ability to analyze multiple sites simultaneously and extract patterns.
Objection-Based Hypothesis Generation
```
My product/service: [description]
Price: $[X]
Target customer: [description]
Current conversion rate: [X%]
Top reasons for cart abandonment (from exit surveys):
1. [reason]
2. [reason]
3. [reason]
Generate 10 test hypotheses that directly address these objections. For each:
- Which objection it addresses
- How the test removes or reduces the friction
- Where in the funnel to implement the change
- Expected impact on objection-driven drop-off
Focus on preemptively answering concerns before they become reasons to leave.
```
Audience-Segment Specific Testing
```
I want to test different approaches for different customer segments.
Segments:
1. [Segment name] - [behavior/demographic characteristics]
2. [Segment name] - [behavior/demographic characteristics]
3. [Segment name] - [behavior/demographic characteristics]
Current approach treats all visitors the same: [describe]
Generate 5 test hypotheses for segment-specific experiences:
- What to personalize (copy, offers, layout, features highlighted)
- Which segment(s) it targets
- How to implement (targeting rules)
- Expected impact per segment
Prioritize segments with highest traffic volume or lifetime value.
```
The Prioritization Framework
AI generates 20-30 hypotheses in minutes. Without systematic prioritization, you'll test mediocre ideas while high-impact opportunities wait in the backlog.
The difference between good testing programs and great ones isn't volume—it's selection. Testing 20 mediocre hypotheses yields less than testing 5 high-impact ones.
ICE Score Method (Recommended)
Rate each hypothesis on three dimensions to create an objective prioritization framework:
Scoring Criteria:
How to Score Each Dimension:
Impact (Expected Conversion Lift):
- Look at similar test results in your industry
- Consider how directly it addresses friction points
- Assess size of affected audience (homepage vs. niche page)
- Example: Homepage value prop = high impact (affects 100% of visitors). Footer link color = low impact (affects 2% who scroll to footer).
Confidence (Probability of Winning):
- Has this pattern won in similar contexts?
- Does it address a known friction point (from data)?
- Is there psychological research supporting it?
- Example: Adding trust badges at checkout = high confidence (wins 78% of tests). Changing font = low confidence (random).
Ease (Implementation Effort):
- Copy-only changes = 10
- CSS/design changes = 8-9
- Template/layout changes = 6-7
- Functional changes = 4-5
- Platform changes = 1-3
ICE Score Formula:
ICE Score = (Impact + Confidence + Ease) ÷ 3

Example:
- Impact: 8 (expect 20-25% lift)
- Confidence: 9 (similar tests won before)
- Ease: 10 (just copy change)
- ICE Score: (8 + 9 + 10) ÷ 3 = 9.0
Complete ICE Scoring Example:
ROI calculated as (expected revenue lift - implementation cost) for first year
How to Use ICE Scores:
- 9.0-10.0: Run immediately - quick wins with high certainty
- 7.0-8.9: Strong candidates for testing queue (weeks 2-4)
- 5.0-6.9: Consider for future sprints (month 2-3)
- Under 5.0: Deprioritize or break into smaller, testable components
Common Scoring Mistakes:
Traffic Requirements by Expected Lift:
Rule: If you don't have enough traffic for a test to reach 95% confidence in 2 weeks, either:
- Test something with higher expected impact
- Test on a higher-traffic page
- Accept longer test duration (but not beyond 4 weeks)
```
Rank these 10 hypotheses using ICE scoring (Impact × Confidence × Ease / 3):
[Paste your 10 hypotheses from earlier prompt]
For each hypothesis:
- Assign Impact score (1-10)
- Assign Confidence score (1-10)
- Assign Ease score (1-10)
- Calculate ICE score
- Rank from highest to lowest
Explain your reasoning for each score.
```
PIE Score Method (Alternative)
For teams preferring PIE:
- Potential (1-10): Room for improvement
- Importance (1-10): Traffic/value of page
- Ease (1-10): Implementation effort
PIE Score = (Potential + Importance + Ease) / 3
```
Rank these hypotheses using PIE scoring (Potential + Importance + Ease / 3):
[Paste hypotheses]
Consider:
- Potential: Current page is terrible (10) vs. already optimized (1)
- Importance: High traffic, high-value page (10) vs. rarely visited (1)
- Ease: Simple copy change (10) vs. complex development (1)
Provide PIE score and ranking for each hypothesis.
```
Industry-Specific Prompt Templates
Ecommerce
```
Ecommerce store: [niche]
Average order value: $[X]
Typical order: [X] items
Return rate: [X%]
Analyze for optimization opportunities across:
1. Product discovery and search
2. Product page conversion
3. Cart and checkout
4. Post-purchase upsells
Generate 15 hypotheses (5 per funnel stage, skip post-purchase). Focus on:
- Reducing uncertainty about product quality
- Simplifying path from browse to purchase
- Increasing average order value
- Mobile shopping experience
Prioritize tests for pages with highest traffic.
```
B2B SaaS
```
B2B SaaS product: [category]
Annual contract value: $[X]
Sales cycle: [X days/weeks]
Current free trial: [terms]
Trial-to-paid conversion: [X%]
Analyze for optimization opportunities:
1. Homepage value proposition clarity
2. Pricing page conversion
3. Free trial sign-up flow
4. In-product activation experience
Generate 15 hypotheses addressing:
- Communicating value to multiple stakeholders (user vs. buyer)
- Reducing perceived risk (security, compliance, migration)
- Accelerating time-to-value in trial
- Converting trial users to paid
Focus on tests that can be implemented without heavy product changes.
```
Lead Generation / Services
```
Service business: [type]
Average project value: $[X]
Lead-to-customer conversion: [X%]
Sales process: [description]
Current lead capture:
- Form fields: [list]
- Qualification questions: [yes/no]
- Response time: [typical timeframe]
- Lead magnet: [offer, if any]
Generate 15 hypotheses:
1. Increasing form submissions (5 hypotheses)
2. Improving lead quality (5 hypotheses)
3. Accelerating lead-to-sale conversion (5 hypotheses)
Balance volume with quality—avoid tests that increase junk leads.
```
The 30-Day Hypothesis Pipeline
Use this prompt to build a full month's testing roadmap:
```
Based on our earlier hypotheses, create a 30-day A/B testing roadmap.
Constraints:
- Can run 2 simultaneous tests (different pages)
- Each test needs 2 weeks minimum for statistical significance
- Traffic: [X visitors/month]
- Conversion rate: [X%]
Prioritize:
- Week 1-2: [Highest ICE score tests]
- Week 3-4: [Next tier tests]
For each test week:
- Which hypothesis to test
- Expected traffic/conversions needed
- Fallback test if first test doesn't reach significance
- Learning objectives (what we'll discover regardless of winner)
Create a testing calendar that maximizes learning velocity.
```
Real Client Example: SaaS Pricing Page Overhaul
We used these prompts with a B2B SaaS client selling project management software.
Initial Prompt:
```
B2B SaaS pricing page: project management tool
Annual contract value: $2,400 - $12,000
Current conversion rate: 3.8%
Three tiers: Starter ($200/mo), Professional ($500/mo), Enterprise (custom)
Current page:
- Feature comparison table (20+ rows)
- Monthly pricing only
- CTA: "Start Free Trial" (all tiers)
- No social proof
- No FAQ section
Generate 10 pricing page test hypotheses focusing on increasing trial sign-ups and higher-tier adoption.
```
AI Generated (Top 5 Hypotheses):
1. Annual Pricing Toggle: Add monthly/annual toggle with "Save 20%" badge on annual (Impact: High, Difficulty: Easy, ICE: 9.2)
2. Social Proof by Tier: Add "[X] companies use Professional" under each tier's CTA (Impact: Medium, Difficulty: Easy, ICE: 8.1)
3. Feature Categorization: Group features into "Core," "Collaboration," "Advanced" categories instead of flat list (Impact: Medium, Difficulty: Medium, ICE: 7.4)
4. Value-Anchored CTAs: Change generic "Start Free Trial" to tier-specific CTAs: "Try Starter Free," "Start Professional Trial," "Talk to Sales" (Impact: Medium, Difficulty: Easy, ICE: 7.8)
5. FAQ Section: Add 8-question FAQ below pricing table addressing common objections (Impact: Medium, Difficulty: Easy, ICE: 7.6)
Implementation:
- Week 1-2: Tested Annual Pricing Toggle (Hypothesis #1)
- Week 3-4: Tested Social Proof by Tier (Hypothesis #2)
Results:
Test 1: Annual Pricing Toggle (2 weeks, 4,800 visitors)
Test 2: Social Proof by Tier (2 weeks, 4,800 visitors)
Revenue Impact:
Annual Toggle: +$288K ARR from higher-value contracts
Social Proof: +$1,098K ARR from higher signup volume and tier mix
Combined: +$1,386K annual recurring revenue
Time invested: 3 hours (hypothesis + implementation)
Return on Investment: $462,000 per hour of work
Common Mistakes in AI Hypothesis Generation
Even with AI assistance, teams make predictable errors that waste testing budget and delay results. Here's what to avoid and how to fix it.
Mistake 1: Vague Prompts Lead to Generic Ideas
Bad Prompt:
``` Give me some A/B test ideas for my website. ```
AI Output (Generic and Useless):
- Change button color from blue to green
- Make headlines bigger
- Add more images
- Test different fonts
- Move CTA higher on page
Why It Fails:
- No context = AI defaults to universal advice that applies to any site
- No consideration of your specific friction points
- No prioritization or expected impact
- No psychological reasoning
- Implementation difficulty unclear
Cost of Vague Prompts:
- Generates 20 hypotheses: 2 are relevant, 18 waste testing budget
- Average test cost: $2,000 (traffic + implementation + analysis)
- Testing 18 irrelevant ideas: $36,000 wasted
Better Prompt:
``` You are analyzing an ecommerce site selling premium fishing gear.
Current metrics:
- 50,000 monthly visitors
- 2.1% conversion rate
- $125 average order value
- 68% mobile traffic
- 42% cart abandonment rate
Audience: 35-65 year old recreational anglers, price-conscious but willing to pay for quality
Top 3 pages: Homepage (50K visitors), Product pages (avg 2.3K each), Checkout (3.2K visitors)
Generate 10 product page hypotheses addressing:
- Trust and credibility for first-time buyers
- Product information completeness (reducing "will this work for me?" questions)
- Mobile image gallery usability
- Shipping cost transparency
For each hypothesis include psychological principle, expected lift, and implementation difficulty. ```
Result Difference:
Mistake 2: Ignoring Implementation Reality
Bad Output:
"Rebuild entire site with personalized experience for 47 micro-segments based on behavioral data, purchase history, demographic attributes, and real-time intent signals."
Why It Fails:
- 6-12 months development time
- $200,000+ implementation cost
- Requires data infrastructure you don't have
- Can't isolate which personalization drives results
- Defeats the purpose of rapid experimentation
Implementation Reality Check:
Fix: Always include in prompt:
"Focus on changes that can be:
- Implemented within 2 weeks
- Tested with current traffic levels
- Deployed without platform changes
- Rolled back instantly if needed
Prioritize copy, layout, and design changes over functional changes."
Mistake 3: Testing Everything Simultaneously
Scenario: AI generates 20 strong hypotheses. Excited, you implement all 20 changes at once and traffic increases 35%.
The Problem: Which changes drove the improvement?
- Was it the new headline? (+30% potential)
- The trust badges? (+15% potential)
- Guest checkout? (+25% potential)
- Product videos? (+40% potential)
- Or all of them? (Unknown)
Why It Matters:
- Can't replicate success on other pages
- Don't know which patterns to apply to new sites
- Might have some changes that hurt conversion (masked by winners)
- Lost all learning value
Real Example - Furniture Ecommerce Site:
Changed 12 elements simultaneously:
- New homepage hero (unknown impact)
- Product page layout (unknown impact)
- Checkout flow (unknown impact)
- Trust badges (unknown impact)
- Shipping messaging (unknown impact)
- CTA copy (unknown impact) ... 6 more changes
Result: 28% conversion increase, but:
- Couldn't determine which changes worked
- 6 months later, tried to optimize product pages—couldn't build on learnings
- Repeated same mistakes on mobile site
- Estimated 40% of the lift came from 2-3 changes (others neutral or negative)
Fix - Proper Testing Strategy:
Rules:
- Sequential tests on same element (homepage hero: test 1, then test 2, then test 3)
- Parallel tests on different elements (homepage + product page + checkout simultaneously)
- Never test 2+ variations of same element at once
Mistake 4: No Success Criteria Defined
Problem: You run a test without defining what "winning" means. Test completes and team debates whether to implement.
Typical Debate:
- Executive: "5% lift isn't worth implementation cost"
- Marketer: "But engagement is up 20%!"
- Developer: "Variant breaks on Safari 12%"
- Analyst: "Not statistically significant yet"
- Finance: "What's the revenue impact?"
Success Criteria Framework:
Example Success Criteria Document:
Test: Guest Checkout vs. Required Account
Primary Metric: Checkout completion rate
Current: 32.4%
Success Threshold: >35.0% (8% relative lift)
Confidence Required: 95%
Sample Size: 5,600 visitors per variant
Duration: 2 weeks (unless reaches significance earlier)
Secondary Metrics:
  - Revenue per visitor (must not decrease >3%)
  - Return customer rate (must not decrease >5%)
Expected Revenue Impact: $72K annually
Implementation Cost: $3,200
Go/No-Go Decision:
  - Implement if meets success threshold
  - Continue 1 more week if 90-94% confidence
  - Kill test if negative after 10 days
Result: No debate. Test reaches 96% confidence at +9.2% lift. Team implements immediately.
Mistake 5: Hypothesis Generation Without Analysis
Scenario: Marketing meeting agenda: "Generate 20 test ideas for Q1."
What's Missing: No one looked at:
- Current conversion funnel (where are drop-offs?)
- Exit pages (where are users leaving?)
- High-bounce pages (what's confusing?)
- Traffic sources (are paid visitors converting differently?)
- Device split (is mobile underperforming?)
- User feedback (what are customers saying?)
Result: Team generates ideas about favorite pages, ignoring the actual problems.
Example - Vitamin Ecommerce Site:
Without Data (Random Ideas):
- Redesign homepage hero
- Change product image sizes
- Add blog section
- Update footer navigation
- New font across site
With Data Analysis:
Funnel Analysis Shows:
- Homepage → Product pages: 45% clickthrough (normal)
- Product pages → Cart: 12% add-to-cart (PROBLEM: should be 18-25%)
- Cart → Checkout: 78% proceed (normal)
- Checkout → Purchase: 42% completion (PROBLEM: should be 65-75%)

Exit Page Analysis:
- Product pages: 34% exit rate (high)
- Checkout page 2: 41% exit rate (high)

Top Objections (exit surveys):
- "Not sure if this will work for me" (42% of responses)
- "Shipping cost too high" (28% of responses)
- "Found cheaper elsewhere" (18% of responses)
With Data (Targeted Ideas):
- Add "Quiz: Find Your Perfect Vitamin" to product pages (addresses "will this work for me?")
- Include comparison chart on product pages (addresses "found cheaper elsewhere")
- Show free shipping threshold earlier (addresses shipping cost objection)
- Add trust badges at checkout step 2 (addresses high exit rate)
- Implement "customers also bought" for bundle deals (increases AOV to offset shipping)
Impact Difference:
Fix: Always run this analysis prompt first:
```
Analyze my Google Analytics data:
Top 10 landing pages by traffic:
[list with bounce rate, conversion rate, traffic]
Top 10 exit pages:
[list with exit rate, previous page]
Conversion funnel:
- Homepage: [X] visitors
- Product pages: [X] visitors ([X%] from homepage)
- Cart: [X] visitors ([X%] from product pages)
- Checkout: [X] visitors ([X%] from cart)
- Purchase: [X] conversions ([X%] from checkout)
Where are the biggest drop-off points? Generate 5 hypotheses targeting the highest-impact friction points.
```
Prompt Chaining for Deep Analysis
Don't stop at one prompt. Chain prompts for deeper insights:
Prompt 1: Generate Ideas
```
[Use Master Prompt Template to generate 10 hypotheses]
```
Prompt 2: Critique and Refine
```
Here are 10 test hypotheses I generated:
[Paste list]
Critique these hypotheses:
- Which are too vague or generic?
- Which require unrealistic implementation effort?
- Which target low-impact areas?
- Which might have unintended negative consequences?
For problematic hypotheses, suggest better alternatives.
```
Prompt 3: Create Testing Sequence
```
Based on refined hypotheses, create optimal testing sequence:
Given:
- 2 simultaneous tests possible
- 2 weeks per test minimum
- Traffic: [X visitors/month]
Create 8-week testing roadmap with:
- Week 1-2: [Tests A and B]
- Week 3-4: [Tests C and D]
- Week 5-6: [Tests E and F]
- Week 7-8: [Tests G and H]
Explain why this sequence maximizes learning velocity.
```
Prompt 4: Variant Creation
```
For Test A (highest priority), create 2 variant versions:
Current: [description]
Hypothesis: [what we're testing]
Variant 1: [describe]
Variant 2: [describe]
Provide exact copy and layout recommendations for both variants.
```
This four-prompt chain takes you from zero to ready-to-implement tests in under 30 minutes.
Building Your Hypothesis Library
Don't start from scratch each month. Build a library of proven prompts and tested hypotheses.
Template Structure:
```
[Client/Site Name] - [Date]
Context
- Business: [description]
- Current CR: [X%]
- Traffic: [X/month]
- AOV: $[X]
Prompt Used
[Exact prompt text]
Hypotheses Generated
1. [Hypothesis with ICE score]
2. [Hypothesis with ICE score]
[...]
Tests Run
- [Hypothesis]: [Result - win/loss/neutral]
- [Hypothesis]: [Result - win/loss/neutral]
Learnings
[Key insights applicable to future tests]
```
Over time, you'll identify patterns:
- Which prompts generate best ideas
- Which types of tests work for your industry
- Which psychological principles resonate with your audience
Next Steps: From Hypotheses to Tests
You now have 20+ testable hypotheses. Here's exactly how to transform them into running experiments that generate revenue.
Your 7-Day Implementation Plan
Day 1: Data Collection & Context Building (2 hours)
Gather the information AI needs to generate relevant hypotheses:
Day 2: Generate Hypotheses (1 hour)
Use the Master Prompt Template + funnel-specific prompts:
- Start with highest-traffic page or highest-impact funnel stage
- Run 3-4 prompts (homepage, product page, checkout, email capture)
- Generate 30-50 total hypotheses
- Document each with expected impact, psychological principle, difficulty
Day 3: Prioritize with ICE Scoring (1 hour)
Score every hypothesis:
- Assign Impact (1-10) based on similar test results
- Assign Confidence (1-10) based on supporting data
- Assign Ease (1-10) based on implementation reality
- Calculate ICE score: (Impact + Confidence + Ease) / 3
- Sort by ICE score, highest to lowest
- Select top 10 for testing queue
Day 4: Define Success Criteria (30 minutes)
For each of your top 5 hypotheses, define:
- Primary metric (what you're optimizing)
- Success threshold (minimum lift to implement)
- Sample size required (calculate with significance calculator)
- Test duration (2-4 weeks)
- Secondary metrics (what can't get worse)
- Go/no-go decision framework
Day 5: Create Test Variants (2-4 hours)
For your highest-priority test:
- Document current version (screenshots, copy, layout)
- Create variant version (implement hypothesis)
- QA on all devices and browsers
- Set up tracking for primary and secondary metrics
- Write test documentation (hypothesis, metrics, success criteria)
Day 6: Launch First Test (1 hour)
- Deploy test using your A/B testing platform
- Verify tracking is working correctly
- Check that traffic is splitting 50/50
- Monitor for first 24 hours to catch any issues
- Document test start date and expected end date
Day 7: Monitor & Plan Next Tests (30 minutes)
- Check test progress (traffic, early indicators)
- Prepare variants for next 2-3 tests in queue
- Review ICE scores—adjust based on new information
- Update testing roadmap for next 4 weeks
- Schedule weekly test review meetings
The 90-Day Roadmap
Month 1: Foundation Building
- Weeks 1-2: Run first 2-3 tests (highest ICE scores)
- Weeks 3-4: Analyze results, implement winners, launch next 2-3 tests
- Goal: Establish testing cadence, validate AI-generated hypotheses
- Expected outcome: 2-3 winning tests, 8-15% cumulative conversion lift
Month 2: Velocity Ramping
- Weeks 5-6: 4-5 simultaneous tests (different pages)
- Weeks 7-8: Refine hypothesis generation based on learnings
- Goal: Increase test velocity, build hypothesis library
- Expected outcome: 4-6 winning tests, 25-40% cumulative lift
Month 3: Optimization & Scale
- Weeks 9-10: 6-8 simultaneous tests across funnel
- Weeks 11-12: Implement all winners, document patterns
- Goal: Full-funnel optimization, establish testing as BAU
- Expected outcome: 8-12 total winners, 35-65% cumulative lift
Success Metrics to Track
Common First-Test Recommendations
Based on 500+ client implementations, these test categories have highest success rates for first tests:
Recommendation: Start with value proposition or trust signals. High win rate, fast implementation, immediate learning.
What to Do Right Now
Don't wait. Take these three actions in the next 30 minutes:
- Open ChatGPT/Claude and paste the Master Prompt Template
- Fill in your business specifics (traffic, conversion rate, audience, top pages)
- Generate your first 10 hypotheses for your highest-traffic page
By lunch, you'll have 10 testable ideas backed by psychological principles and prioritized by expected impact.
By next week, you'll have your first test live.
By next month, you'll have measurable revenue improvements.
The difference between testing programs that stall and those that drive 7-figure revenue improvements isn't technical capability or team size—it's velocity. AI gives you velocity.
Run the first prompt today.
--- About WE•DO Worldwide
We're a bolt-on marketing team that runs rapid experimentation programs for growth-focused companies. Our clients typically see 15-20 tests per month using AI-accelerated workflows like these. Learn more about our growth marketing services.
Ready to Transform Your Growth Strategy?
Let's discuss how AI-powered marketing can accelerate your results.