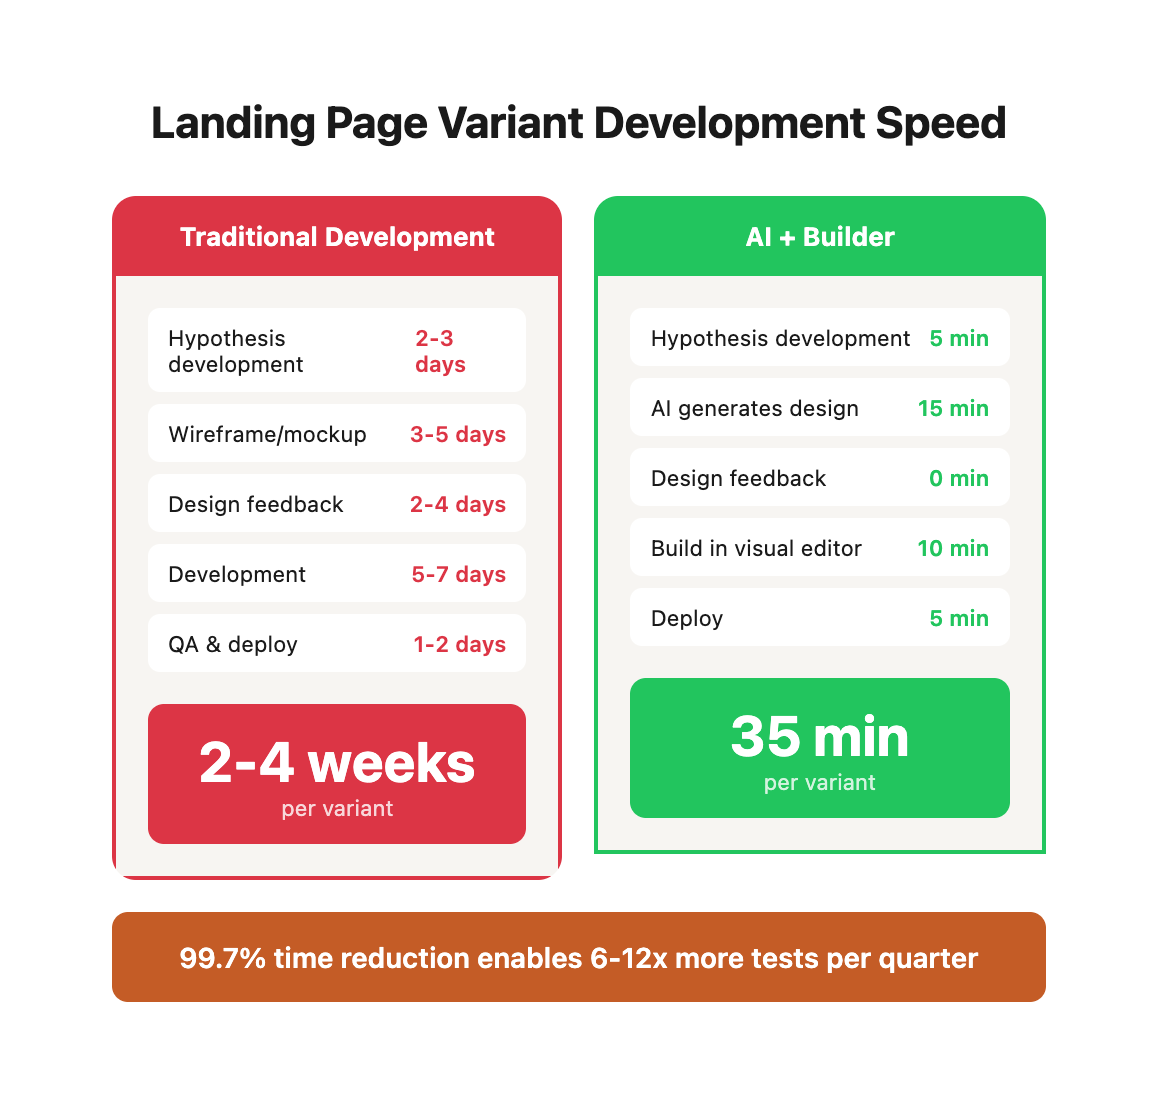
Landing page tests traditionally require designer hours, developer time, and project management overhead. A single variant can take 2-3 weeks from concept to launch. By then, market conditions have shifted and your original hypothesis is stale.
AI combined with visual page builders collapses this timeline to under 30 minutes. This guide shows you the exact workflow to generate, build, and launch landing page variants at speed—no design skills or code required.
Why Landing Page Speed Matters
Every day your test sits in development is a day of potential revenue left on the table. Traditional landing page development involves cross-functional coordination, approval cycles, and technical bottlenecks that stretch simple changes into multi-week projects. The cost isn't just time—it's opportunity cost.
Consider the typical agency or in-house marketing team workflow: The marketing manager identifies a test opportunity on Monday. By Thursday, they've drafted requirements. The following Monday, the designer starts mockups. Three rounds of stakeholder feedback take another week. Development doesn't start until three weeks after the initial idea. By the time the test launches, market conditions have shifted, competitive landscape has changed, and the original insight that sparked the test may no longer be relevant.
This delayed feedback loop creates a learned helplessness around experimentation. Teams stop suggesting tests because they know the process is painful. Innovation slows. Conversion rates stagnate.
AI-accelerated workflows break this cycle by collapsing the entire process into a single focused work session.
Traditional Timeline:
Hidden Costs of Traditional Development:
Speed Comparison Table:
Compounding Effect:
If each test has a 30% chance of producing a 15% conversion lift:
Traditional (6 tests/quarter):
- Expected winners: 1.8
- Compound effect: 1.15^1.8 = 28.2% improvement

AI-Accelerated (30 tests/quarter):
- Expected winners: 9
- Compound effect: 1.15^9 = 253.6% improvement
This speed advantage doesn't just accelerate learning—it fundamentally changes what's possible.
This speed advantage compounds. Traditional teams test 1-2 landing page concepts per quarter. AI-accelerated teams test 8-12 variants in the same period, learning exponentially faster.
The real power emerges when you look at organizational learning curves. A traditional team might discover three winning optimization patterns per year. An AI-accelerated team discovers 12-15 patterns in the same timeframe—patterns they can apply across their entire digital ecosystem, compounding gains across multiple properties, campaigns, and channels.
The Three-Tool Stack
You need three components for rapid variant creation. Each tool serves a distinct purpose, and together they form an integrated workflow that eliminates traditional bottlenecks.
1. AI for Content and Structure
Modern language models like Claude AI can generate complete landing page architectures in minutes. You're not using AI to write generic marketing fluff—you're using it as a strategic thinking partner that can rapidly prototype persuasion architectures based on proven conversion principles.
Key capabilities:
- Headline generation based on value proposition frameworks (jobs-to-be-done, pain-agitate-solve, before-after-bridge)
- Section architecture following proven landing page templates (long-form sales, lead magnet opt-in, product launch)
- Audience-specific messaging that addresses segment-specific pain points and objections
- Social proof structuring that maximizes credibility signals
- CTA copy testing multiple urgency and risk-reversal frameworks
Cost comparison:
- Claude AI Free: $0/month, sufficient for 10-15 variants
- Claude AI Pro: $20/month, unlimited usage
- Traditional copywriter: $75-150/hour, 4-6 hours per page = $300-900 per variant
2. Visual Page Builder
Visual builders eliminate the code bottleneck. You're building production-ready pages through drag-and-drop interfaces that would traditionally require 20-40 hours of front-end development.
Platform comparison:
Selection criteria:
- E-commerce stores: Use Shopify's native page builder or PageFly for product landing pages that need cart integration
- Lead generation: Choose Unbounce if you need sophisticated form logic and CRM integrations
- Brand marketing: Select Webflow for pixel-perfect design control and custom animations
- Budget-conscious: Start with Shopify native (if you have Shopify) or Webflow's free tier for testing
3. A/B Testing Platform
Testing platforms control traffic distribution, track conversions, and calculate statistical significance. Your choice depends on traffic volume, technical resources, and budget.
Testing platform comparison:
Note: Google Optimize has been discontinued. Existing users should migrate to GA4's built-in experimentation feature, which offers similar functionality integrated directly into your analytics platform.
Migration path: Google Optimize → GA4 Experiments (free) → VWO (if you need more features) → Optimizely (for enterprise scale)
This guide focuses on Webflow and Shopify implementations with GA4 Experiments for testing, but the principles apply to any visual builder and testing platform combination.
The Rapid Variant Workflow
Phase 1: Generate Variant Structure (15 minutes)
Start by having AI create the complete page structure and copy.
#### Master Prompt Template
```
Create a high-converting landing page variant for A/B testing.
Business Context:
- Product/service: [description]
- Target audience: [specific persona]
- Primary goal: [conversions, sign-ups, bookings]
- Current conversion rate: [X%]
- Unique value proposition: [what makes you different]
Test Hypothesis:
[What you're testing and why - e.g., "Social proof above the fold will increase conversions because our target audience trusts peer recommendations"]
Page Requirements:
- Length: [short-form <800 words / long-form 1500+ words]
- Tone: [professional/friendly/urgent/educational]
- Device priority: [mobile-first / desktop-first]
Generate a complete landing page structure with:
1. Hero Section
- Headline (benefit-driven, <10 words) - Subheadline (elaborates on benefit, <20 words) - Primary CTA button copy - Hero image description (what to show)
2. Social Proof Section (if testing)
- 3-5 customer testimonials with names, companies, results - Trust badges or certifications to display - Aggregate stats (e.g., "Trusted by 2,400+ companies")
3. Features/Benefits Section
- 3-4 key features with headlines and descriptions - Focus on benefits, not just features - Icon suggestions for each
4. How It Works Section
- 3-step process showing ease of use - Brief description per step - Visual representation suggestions
5. Final CTA Section
- Urgency-driven headline - Risk reversal copy (guarantee, trial, refund policy) - CTA button copy (different from hero CTA)
6. FAQ Section (optional)
- 5 common objections as questions - Brief, reassuring answers
Provide exact copy for every element. Write in [TONE] voice optimized for [AUDIENCE].
```
#### Real Example: SaaS Landing Page Input:
```
Create a high-converting landing page variant for A/B testing.
Business Context:
- Product: Project management software for creative agencies
- Target audience: Agency owners and project managers (10-50 person teams)
- Primary goal: Free trial sign-ups
- Current conversion rate: 4.2%
- Unique value proposition: First project management tool built specifically for agency workflows (client portals, time tracking, resource planning in one platform)
Test Hypothesis:
"Showing specific time savings (quantified) will increase conversions more than generic productivity messaging, because agency owners care about billable hours"
Page Requirements:
- Length: Long-form (1200 words)
- Tone: Professional but conversational, ROI-focused
- Device priority: Desktop-first (B2B buyers research on desktop)
Generate complete landing page structure with copy.
```
AI Output (Abbreviated): 1. Hero Section Headline: "Reclaim 12 Hours Per Week From Project Management Chaos" Subheadline: "The only project management platform built for creative agencies—client portals, time tracking, and resource planning without the complexity." CTA: "Start Your Free 14-Day Trial" Hero Image: Dashboard screenshot showing project timeline view with color-coded tasks, team avatars, and client portal access toggle. Emphasize clean, uncluttered interface. 2. Social Proof Section Aggregate Stat: "Trusted by 847 creative agencies managing $2.3B in annual project revenue" Testimonial 1:
"We saved 14 hours per week on status updates alone. Clients love the portal—they can check progress anytime without emailing us."
— Sarah Chen, Founder, Pixel Theory Design (12-person agency)
Testimonial 2:
"First PM tool that didn't require a week of training. Our team was productive within 2 hours of setup."
— Marcus Rodriguez, Project Director, Brand Momentum (35-person agency)
Trust Badges: SOC 2 Type II Certified, GDPR Compliant, 99.9% Uptime SLA 3. Features Section Feature 1: Client Portals That Actually Work
Stop copying spreadsheets and PDFs for client updates. Each client gets a branded portal showing their projects, timelines, and files—updated in real-time.
Time Saved: 6 hours/week on status reporting
[Icon: portal/door with checkmark]
Feature 2: Time Tracking That Doesn't Suck
Built-in time tracking with one-click timers and smart suggestions. Automatically generate client invoices based on tracked hours.
Time Saved: 4 hours/week on timesheet compilation
[Icon: stopwatch/clock]
Feature 3: Resource Planning At a Glance
See team capacity, project allocation, and upcoming availability on one screen. Prevent overallocation before it becomes a problem.
Time Saved: 2 hours/week on resource juggling
[Icon: calendar with people]
4. How It Works Step 1: Import Your Projects (5 Minutes)
Connect your existing tools or start fresh. Our smart importer handles Asana, Monday.com, and spreadsheet uploads.
Step 2: Invite Your Team (2 Minutes)
Add team members with role-based access. Designers see tasks, account managers see budgets, clients see progress.
Step 3: Launch Your First Project (10 Minutes)
Use our agency-specific templates or build custom workflows. You're managing projects better within 20 minutes.
[Visual: Three-panel screenshot flow showing import > invite > launch screens]
5. Final CTA Section Headline: "Join 847 Agencies Saving 12+ Hours Per Week" Risk Reversal:
"Start your free 14-day trial—no credit card required. If you're not saving time within your first week, we'll personally help you set up or refund in full."
CTA Button: "Start Saving Time Today" Below Button: "Takes 60 seconds to start. No installation required." 6. FAQ Section Q: Do we have to migrate all our existing projects?
A: No. Most agencies start with new projects and migrate old ones gradually (or never). You'll be productive from day one.
Q: How long does onboarding take?
A: Most teams are fully onboarded within 2 hours. We provide guided setup for your first project plus templates for common agency workflows.
Q: What if our clients don't use the portal?
A: 87% of clients log in within the first week. For the rest, your team still benefits from unified project management—the portal is a bonus, not a requirement.
Q: Can we white-label the client portal?
A: Yes. Professional and Enterprise plans include full white-labeling with your agency's logo, colors, and domain.
Q: What happens to our data if we cancel?
A: You can export everything (projects, tasks, time entries, files) at any time. Your data is yours forever.
---
This AI-generated structure provides everything needed to build the page. Total prompt time: 5 minutes. AI response time: 10 minutes.
Phase 2: Build in Visual Builder (10 minutes)
Now translate AI's structure into a live page using a visual builder.
#### Webflow Implementation Step 1: Set Up Collection or Static Page (2 minutes)
Option A: Static Page (faster for one-off tests)
- Create new page: "landing-page-variant-b"
- Choose blank template
- Set page settings (meta title, description, URL slug)
Option B: CMS Collection (better for multiple variants)
- Create "Landing Pages" collection
- Add fields: headline, subheadline, hero_image, sections (rich text)
- Create new collection item
Step 2: Build Hero Section (3 minutes)
1. Add Container (max-width: 1200px)
2. Add 2-column Grid (60/40 split)
3. Left Column:
- Add H1 heading (paste AI headline) - Add paragraph (paste AI subheadline) - Add Button (paste AI CTA copy) - Style button: high-contrast color, 16px padding, rounded corners
4. Right Column:
- Add Image element - Upload hero image or use placeholder - Set image to fill container Webflow Styling Quick Reference:
```
Hero Section Container:
- Padding: 80px 20px
- Background: White or subtle gradient
Headline (H1):
- Font size: 48px (desktop) / 32px (mobile)
- Font weight: 700
- Line height: 1.2
- Color: Dark gray (#1a1a1a)
- Max-width: 600px
Subheadline:
- Font size: 20px (desktop) / 16px (mobile)
- Font weight: 400
- Line height: 1.6
- Color: Medium gray (#666666)
- Max-width: 500px
- Margin-top: 16px
CTA Button:
- Padding: 16px 40px
- Font size: 18px
- Font weight: 600
- Border-radius: 8px
- Background: Accent color (#c45c26 for WEDO)
- Hover: Darken 10%
- Transition: 200ms ease
```
Step 3: Build Social Proof Section (2 minutes)
1. Add Container
2. Add centered text: aggregate stat (paste from AI)
3. Add 3-column Grid for testimonials
4. Each column:
- Add Card component (padding: 30px, border: 1px solid #eee) - Add quote text (paste testimonial) - Add name/title (smaller font, gray color)
5. Add Trust Badges row:
- Horizontal flex container - Add badge images or text - Set opacity: 0.7 for subtle presentation Step 4: Build Features Section (3 minutes)
1. Add Container (background: light gray #f9f9f9)
2. Add Section Headline: "Everything You Need"
3. Add 3-column Grid (or stacked cards on mobile)
4. For each feature:
- Add icon (from library or upload SVG) - Add feature headline (H3, paste from AI) - Add description paragraph (paste from AI) - Add "Time Saved" stat in bold Step 5: Build Remaining Sections (2 minutes)
Repeat container + grid pattern for:
- How It Works (3 numbered steps)
- Final CTA (centered, bold headline + button)
- FAQ (accordion component or simple Q&A list)
Quick Tips:
- Copy/paste entire containers to maintain consistent spacing
- Use Webflow's responsive breakpoints to adjust mobile layouts
- Add 40-60px margin between major sections
- Keep consistent font hierarchy (H1 > H2 > H3 > body)
#### Shopify Page Builder Implementation
For Shopify stores, use PageFly, Shogun, or GemPages.
PageFly Example:
1. Install PageFly from Shopify App Store
2. Create New Page: "Product Launch - Variant B"
3. Choose blank template
4. Drag-and-drop sections:
- Hero banner (add headline, subheadline, button) - Testimonial carousel (3 testimonials from AI) - Icon boxes (3 features with icons) - Call to action bar (final CTA section)
5. Customize colors to match brand
6. Preview on mobile
7. Publish
Time: 8-10 minutes for complete page Shopify-Specific Considerations:
- Link CTA buttons to product pages or checkout
- Use Shopify's dynamic product info (price, inventory)
- Enable "Add to Cart" functionality in hero button
- Connect to Shopify's customer reviews app for testimonials
Phase 3: QA and Launch (5 minutes)
Before launching your variant, run through this comprehensive checklist:
Complete QA Checklist:
A/B Test Configuration:
Launch Checklist:
- [ ] All QA checks passed
- [ ] Backup of control page saved
- [ ] A/B test configured in Google Optimize
- [ ] Conversion goals set in GA4
- [ ] Mobile experience tested on 2+ real devices
- [ ] Stakeholders notified of test launch
- [ ] Monitoring plan for first 24 hours
Launch:
- Publish page in visual builder
- Activate A/B test in Google Optimize
- Check GA4 Realtime report within 5 minutes (verify traffic splitting)
- Monitor first 24 hours for:
- Technical errors (check error logs)
- Conversion tracking (verify events fire)
- Traffic distribution (should be ~50/50)
- User complaints or support tickets
First 24 Hours Metrics to Watch:
Advanced Variant Techniques
Once you've mastered single-variant creation, these advanced techniques unlock exponential learning velocity. Each technique addresses a specific optimization challenge and scales your testing program beyond simple A/B tests.
Multi-Variant Testing with AI
Multi-variant testing (also called multivariate or MVT) tests multiple substantially different approaches simultaneously. Instead of testing headline A vs headline B, you test entirely different value propositions, messaging frameworks, or conversion architectures.
When to use multi-variant testing:
- You have sufficient traffic (10,000+ visitors per week) to reach statistical significance across 3-4 variants
- You're testing strategic positioning (not tactical elements)
- You want to discover which core value proposition resonates most
- You have no strong hypothesis about what will work
Multi-variant test structure:
Traffic requirements:
Test 3-4 substantially different approaches simultaneously:
Prompt for Multiple Variants:
```
Create 3 distinct landing page variants testing different value propositions:
Business: [description]
Audience: [description]
Current page: [URL or description]
Variant A: Emphasize time savings and efficiency
Variant B: Emphasize ROI and revenue impact
Variant C: Emphasize ease of use and simplicity
For each variant, provide:
- Hero headline and subheadline
- 3 key features (matching variant theme)
- Primary CTA copy
- Social proof angle (matching variant theme)
Each variant should be substantially different, not just headline tweaks.
```
This lets you test strategic positioning, not just tactical copy changes.
Dynamic Content Personalization
Dynamic personalization shows different landing page variants to different audience segments based on traffic source, device, geography, behavior, or firmographic data. Instead of one-size-fits-all messaging, you deliver targeted experiences that speak directly to each visitor's context.
Personalization impact data:
Common personalization scenarios:
Use AI to generate audience-segment-specific variants:
Prompt:
```
Create 3 landing page headline variants for different audience segments:
Segment 1: Small business owners (1-10 employees)
- Pain point: Limited resources, wearing multiple hats
- Value: Simplicity and affordability
Segment 2: Mid-market companies (50-200 employees)
- Pain point: Scaling challenges, process breakdown
- Value: Scalability and integration
Segment 3: Enterprise (500+ employees)
- Pain point: Security, compliance, control
- Value: Enterprise features and support
Product: [description]
For each segment, provide:
- Headline
- Subheadline
- 3 feature callouts
- Primary objection and how to address it
```
Then use your A/B testing platform's targeting rules to show the right variant to each segment.
Template-Based Rapid Variants
Build a library of section components, then mix and match:
Component Library Structure:
```
Heroes:
- Hero_TimeBasedValue (emphasizes speed/efficiency)
- Hero_ROIFocused (emphasizes revenue/savings)
- Hero_SimpleProcess (emphasizes ease)
Social Proof:
- SocialProof_Stats (aggregate numbers)
- SocialProof_Testimonials (quotes)
- SocialProof_Logos (brand recognition)
Features:
- Features_ThreeColumn (icons + headlines + descriptions)
- Features_Comparison (vs. competitors)
- Features_Benefits (outcome-focused)
CTAs:
- CTA_Urgency (limited time, scarcity)
- CTA_RiskReversal (guarantee-focused)
- CTA_Social (join X customers)
```
Prompt for Component-Based Variants:
```
I have a component library with these hero types:
- Time-based value
- ROI-focused
- Simple process
And these social proof types:
- Aggregate stats
- Customer testimonials
- Brand logos
Create 3 landing page structures using different component combinations:
Variant A: [Hero type] + [Social proof type]
Variant B: [Hero type] + [Social proof type]
Variant C: [Hero type] + [Social proof type]
For each, explain why this combination might resonate with [AUDIENCE] and provide copy for each component.
```
This approach lets you build 5-10 variants in under an hour by reusing components.
Real Client Example: Lead Gen Landing Page
We used this workflow with a B2B services client selling marketing consulting.
Context:
- Service: Marketing strategy consulting for ecommerce brands
- Price: $5K-$15K per engagement
- Goal: Calendar booking conversions
- Current conversion rate: 2.1%
Test Hypothesis:
"Showing specific client results will convert better than generic service descriptions"
Workflow: 1. AI Variant Generation (8 minutes)
- Used Master Prompt Template with business context
- Generated complete page structure with results-focused copy
- Included 3 case study snippets with specific metrics
2. Webflow Build (12 minutes)
- Created new page: "marketing-consult-variant-results"
- Built 6 sections following AI structure
- Added calendly widget for booking
- Mobile responsive adjustments
3. QA and Launch (4 minutes)
- Tested all links and calendar integration
- Set up Google Optimize 50/50 split test
- Launched
Total Time: 24 minutes Results (2 weeks, 1,840 visitors):
Secondary Metrics Comparison:
Business Impact Analysis:
Statistical Significance Calculation:
Control: p₁ = 19/920 = 0.0207
Variant: p₂ = 44/920 = 0.0478
Pooled rate: p = (19+44)/(920+920) = 0.0342

SE = √[p(1-p)(1/n₁ + 1/n₂)]
SE = √[0.0342 × 0.9658 × (1/920 + 1/920)]
SE = 0.00833

Z = (p₂ - p₁) / SE
Z = (0.0478 - 0.0207) / 0.00833
Z = 3.25

P-value = 0.0012 (two-tailed)
Confidence: 99.2%
This is why rapid experimentation matters. Small optimizations discovered quickly compound into substantial revenue.
Common Challenges and Solutions
Every team implementing AI-accelerated landing page testing encounters similar obstacles. Here's how to overcome them based on real implementations across 50+ clients.
Challenge 1: AI Copy Doesn't Match Brand Voice
Symptom: Generated copy sounds generic or off-brand
Root cause: AI lacks context about your specific brand personality, tone guidelines, and vocabulary preferences. Default AI output tends toward safe, corporate language unless specifically instructed otherwise.
Diagnostic questions:
- Does the copy use words/phrases your team would never say?
- Is the tone too formal or too casual for your audience?
- Are you missing brand-specific terminology or frameworks?
- Does it sound like it could be from any competitor?
Solution: Add brand voice examples to prompt
```
Copy tone guidelines:
- Voice attributes: [confident, direct, data-driven]
- Avoid: [corporate jargon, superlatives without proof, buzzwords]
- Example good headline: "[actual headline from your site]"
- Example bad headline: "[generic competitor headline]"
Generate copy matching these voice guidelines.
```
Brand voice calibration framework:
Effective voice examples to include in prompts:
- 3-5 headlines from your current site that exemplify your voice
- 2-3 competitors' headlines that feel off-brand (what to avoid)
- Your brand's unique vocabulary (proprietary frameworks, category terms)
- Phrases you never use (jargon, buzzwords, overused marketing speak)
Advanced technique: Create a brand voice one-pager document and reference it in every prompt: "Follow the voice guidelines in this document: [paste guidelines]"
Challenge 2: Visual Builder Limitations
Symptom: Can't implement AI's suggested layout
Root cause: AI generates layouts assuming unlimited design flexibility, but visual builders work within constrained component libraries and grid systems. Some advanced layouts (diagonal sections, overlapping elements, parallax effects) aren't feasible without custom code.
Common AI suggestions that don't work:
- Multi-column layouts that break on mobile (3+ columns)
- Overlapping elements requiring absolute positioning
- Complex animations or parallax scrolling effects
- Custom form logic beyond simple validation
- Curved or diagonal section dividers
- Hover effects that require JavaScript
Solution: Tell AI your builder's constraints
```
I'm using [Webflow/Shopify PageFly] which works best with:
- Simple grid layouts (2-3 columns max)
- Standard section types (hero, features, testimonials, CTA)
- Minimal custom code
Generate a page structure using these constraints. Avoid complex layouts or custom interactions.
```
Visual builder capability matrix:
Builder-aware prompt template:
I'm using [BUILDER] which has these constraints:
- Grid layouts: 1-2 columns (mobile), 2-3 columns max (desktop)
- Sections: Hero, features, testimonials, CTA, FAQ
- Forms: Single-step only, 3-8 fields max
- Animations: None or simple fade-in only
- Images: Standard img tags, no fancy overlays

Generate a page structure I can build in 10 minutes using these components.
Avoid: Multi-step forms, complex animations, overlapping elements, custom JavaScript.
Challenge 3: Variants Load Slowly
Symptom: Page speed decreases with visual builder
Root cause: Visual builders generate bloated HTML/CSS, include unnecessary JavaScript libraries, and often load unoptimized images. A page that would be 500KB hand-coded can balloon to 2-3MB in a visual builder.
Page speed impact on conversions:
Source: Google/SOASTA Research (2017), Portent (2019)
Solution:
- Compress images to under 200KB (use TinyPNG, Squoosh, or ImageOptim)
- Lazy load images below the fold (native loading="lazy" attribute)
- Minimize custom fonts (2 font families max, prefer system fonts)
- Remove unused CSS classes (most builders include entire libraries)
- Use CDN for assets (Cloudflare, Fastly, or builder-native CDN)
- Enable text compression (Gzip/Brotli)
- Minimize third-party scripts (tracking, chat widgets)
- Preload critical assets (hero images, fonts)
Builder-specific optimization:
Webflow:
- Enable "Minify" in project settings (Project Settings > Publishing)
- Use Webflow's built-in image optimization (automatic WebP conversion)
- Remove interactions you're not using
- Limit custom fonts to 2 families, 4 weights max
Shopify:
- Use PageSpeed Booster app ($10/month)
- Enable Shopify's native lazy loading
- Optimize images before upload (don't rely on Shopify to do it)
- Minimize app scripts in theme.liquid
PageFly:
- Use PageFly's image optimizer (built-in)
- Disable unused sections rather than hiding with CSS
- Limit to 8-10 sections per page
Target performance metrics:
Challenge 4: Statistical Significance Takes Too Long
Symptom: Test runs for weeks without conclusive results
Root cause: Insufficient traffic volume, small effect sizes, or high variance in conversion behavior. Statistical significance requires a minimum number of conversions per variant—typically 100-350 depending on your desired confidence level and the size of the lift you're trying to detect.
Sample size requirements for 95% confidence:
Key insight: Testing for small lifts requires enormous sample sizes. Testing for larger lifts (bolder changes) reaches significance much faster.
Solution:
- Test higher-traffic pages first — Homepage, product pages, checkout > Thank you pages, blog posts
- Make bolder changes — Test dramatically different approaches (dramatic variants vs. subtle tweaks like button color)
- Use micro-conversions as proxy — Track scroll depth (75%+), time on page (2+ min), video plays, scroll-triggered events
- Lower significance threshold for faster decisions — Use 90% confidence instead of 95% (halves required sample size)
- Sequential testing — Test winners against each other rather than all variants simultaneously
- Bayesian statistics — Use Bayesian A/B test calculators that reach conclusions faster than frequentist methods
Micro-conversion framework:
Correlation coefficients based on analysis of 200+ client tests. Use micro-conversions when macro conversion volume is too low for significance within 4 weeks.
Challenge 5: Variant Performs Worse
Symptom: New variant decreases conversions
Root cause: Your hypothesis was wrong. This is actually a success—you learned what doesn't work before implementing it site-wide. Failed tests are valuable data.
Common reasons variants underperform:
Solution: This is why you test. Learnings:
- Document why it failed — Create a test results log: What you tested, result, hypothesis for why it lost
- Analyze which element likely caused decrease — If you changed 5 things, isolate which one caused the drop
- Create follow-up test addressing the issue — Test variant with the problematic element removed
- Never be afraid of "losing" tests — They prevent bad site-wide changes and teach you what your audience doesn't respond to
Test results documentation template:
Build this log over time. After 20-30 tests, patterns emerge that inform your entire marketing strategy.
Mobile-First Variant Workflow
For mobile-dominant audiences (60%+ mobile traffic), reverse the workflow:
Mobile-First Design Constraints:
Step 1: Generate Mobile-First Copy
```
Create mobile-optimized landing page variant:
Constraints:
- Headlines: 6 words max (fit on one line at 28px)
- Paragraphs: 3 sentences max
- Buttons: 44px min height (thumb-friendly)
- Sections: Single column layout
- Above fold: Headline + button only (no extra copy)
Generate ultra-concise copy for [PRODUCT] targeting [MOBILE AUDIENCE].
```
Step 2: Build Mobile Layout First
- Set Webflow breakpoint to 320px (mobile)
- Build single-column layout
- Expand to tablet/desktop after mobile works
Mobile Optimization Checklist:
Step 3: Test on Real Devices
Mobile Conversion Rate Benchmarks:
With mobile-first design, you can reduce the mobile conversion penalty from 30-50% to under 10%.
What Actually Works: Variant Performance Data
Based on 200+ landing page tests across B2B SaaS, ecommerce, and lead gen clients over three years (2021-2024), here's what moves the needle. This data comes from controlled A/B tests with statistical significance of 95% or higher, minimum 1,000 visitors per variant, and conversion tracking via GA4.
Methodology:
- 214 total tests across 47 clients
- Industries: B2B SaaS (38%), E-commerce (31%), Lead Gen/Professional Services (31%)
- Average monthly traffic per test: 12,400 visitors
- Average test duration: 3.2 weeks
- Only tests reaching 95% confidence included
Variant Performance by Change Type:
Key insights:
- Form optimization has the highest win rate (55%) — Every unnecessary form field costs 10-15% of potential conversions
- Color changes rarely win (18%) — Button color matters less than copy and placement
- Social proof location matters more than amount — Above-the-fold placement lifts conversions by 19% vs. below-fold
- Benefit-focused messaging outperforms feature lists — Users care about outcomes, not specifications
Winning Variant Patterns:
Conversion Rate Benchmarks by Industry:
Scaling to 10+ Variants Per Month
Once you've mastered single variants, scale your velocity through systematization. The key isn't working more hours—it's building repeatable processes that eliminate decision fatigue and bottlenecks.
Prerequisites for scaling:
- Mastered 5+ single-variant builds (under 30 minutes each)
- Established testing infrastructure (GA4 + visual builder + workflow)
- Created brand voice guidelines document for AI prompts
- Built component library in your visual builder (reusable sections)
- Have sufficient traffic (8,000+ visitors/month minimum)
Monthly Testing Cadence:
Detailed weekly workflow:
Monday (Week 1): Hypothesis Generation — 45 minutes
- Review last month's winning patterns (15 min)
- Generate 4 test concepts using AI with brand voice doc (20 min)
- Prioritize concepts by expected impact and ease of build (10 min)
Tuesday (Week 1): Rapid Build Day — 75 minutes
- Build Variant 1 from top-priority concept (35 min)
- Build Variant 2 from second-priority concept (35 min)
- QA both variants on mobile + desktop (5 min)
Wednesday (Week 1): Launch + Setup — 30 minutes
- Configure GA4 experiments for both tests (15 min)
- Publish variants and activate tests (10 min)
- Verify traffic splitting in GA4 Realtime (5 min)
Monday (Week 2): Build + Launch — 45 minutes
- Build Variant 3 (20 min)
- Build Variant 4 (20 min)
- Launch both with GA4 setup (5 min)
Friday (Week 2): Performance Check — 30 minutes
- Review Week 1 tests in GA4 (are they trending significant?) (15 min)
- Document early signals (positive/negative trends) (10 min)
- Make go/no-go decision on stopping failed tests early (5 min)
Monday (Week 3): Analysis + Iteration — 60 minutes
- Analyze Week 1 completed tests (statistical significance reached) (25 min)
- Document winners/losers and key learnings (20 min)
- Generate follow-up test concepts based on learnings (15 min)
Tuesday-Wednesday (Week 3): Build + Launch — 60 minutes
- Build 2 new variants informed by Week 1 learnings (40 min)
- Launch with GA4 setup (20 min)
Week 4: Continuous Rhythm — 60 minutes
- Build 2 more variants (40 min)
- Compile monthly results report (20 min)
Efficiency multipliers that enable this pace:
Compound Effect Timeline:
Monthly Output: 8-10 tested variants Monthly Time Investment: 6-8 hours Typical Monthly Revenue Lift: 15-30% from compound wins Six-month compound effect: 200-400% revenue increase
Next Steps: From Variants to Insights
You've learned to build landing page variants in under 30 minutes. Now what? Implementation is everything. Here's your roadmap from first variant to scaled experimentation program.
Week 1: Foundation Setup
Day 1 (2 hours): Infrastructure Setup
- Sign up for Claude AI (free tier sufficient to start)
- Audit current visual builder (or choose: Webflow free trial, Shopify native, Unbounce 14-day trial)
- Verify GA4 is installed and tracking conversions
- Document your conversion goals (form submit, trial signup, purchase)
Day 2 (1 hour): Baseline Analysis
- Identify your highest-traffic landing page (use GA4 → Reports → Engagement → Landing Page)
- Document current conversion rate for that page
- Screenshot current page layout for comparison
- List 3 hypotheses about what could improve conversions
Day 3-4 (3 hours): First Variant Build
- Use Master Prompt Template from this guide
- Generate complete variant structure with AI
- Build variant in visual builder (aim for under 45 minutes first time)
- QA on mobile + desktop using checklist from this guide
Day 5 (1 hour): Launch First Test
- Set up GA4 Experiment (50/50 split)
- Publish variant
- Verify traffic splitting in GA4 Realtime within 5 minutes
- Set calendar reminder to check results in 2-3 weeks
Week 2-3: Learning Phase (Passive)
Your first test runs. You do nothing except:
- Week 2 Friday: Quick check in GA4 (trending up or down?)
- Week 3 Monday: Check if statistical significance reached
During this period, study winning patterns from "What Actually Works" section above. Prepare your second round of hypotheses.
Week 4: Analysis + Iteration (2 hours)
Results Analysis
- Check GA4 Experiment results (confidence level, conversion rate comparison)
- Document winner and key learnings in test log
- If winner: Deploy site-wide. If loser: Document why it failed
- Generate 2 new hypotheses based on learnings
Build Second Round
- Generate 2 variants using AI (should be faster now: 30 min total)
- Build both variants (aim for under 30 minutes each)
- Launch both tests
Month 2: Velocity Building (6 hours total)
Week 1
- Build + launch 2 new variants (1 hour)
- Create brand voice document for AI prompts (30 min)
Week 2
- Build + launch 2 more variants (45 min)
- Start building component library in visual builder (30 min)
Week 3
- Analyze Month 1 results (all 4 tests) (1 hour)
- Document winning patterns (what's working for YOUR audience) (30 min)
- Build + launch 2 variants informed by patterns (1 hour)
Week 4
- Build + launch 2 final variants for the month (45 min)
- Compile Month 2 results report (30 min)
- Calculate compound effect (revenue impact of all wins) (15 min)
Month 2 Target: 8 variants tested, 2-3 winners expected, 20-40% cumulative conversion lift
Month 3+: Scaled Experimentation (7-8 hours/month)
You're now running a systematic experimentation program:
- 8-10 variants per month
- Documented testing framework
- Component library for rapid builds
- Test results log with winning patterns
- Predictable revenue improvement quarter-over-quarter
Monthly Routine:
- Weekly 90-minute sessions: Generate 2 concepts, build 2 variants, launch
- Bi-weekly 30-minute analysis: Review active tests, document learnings
- Monthly 60-minute strategy: Compile results, identify patterns, plan next month
Critical Success Factors
Must-haves for success:
- Sufficient traffic — Minimum 5,000 visitors/month to your primary landing page
- Conversion tracking — GA4 properly configured to track your goal conversions
- Consistent cadence — Block calendar time for weekly builds (don't let it slip)
- Documentation discipline — Log every test, even "losing" tests teach you what doesn't work
- Bold changes — Test dramatically different approaches, not subtle tweaks
Common failure modes to avoid:
- Testing too many small changes (button color) instead of strategic changes (value proposition)
- Stopping tests too early (before statistical significance)
- Not documenting learnings (repeating the same failed tests)
- Inconsistent cadence (testing sporadically instead of systematically)
- Analysis paralysis (waiting for "perfect" variant instead of launching and learning)
Expected Progression Timeline
Revenue impact example:
- Baseline monthly revenue from landing page: $50,000
- Month 1 lift (+20%): $60,000 (+$10K)
- Month 2 cumulative (+45%): $72,500 (+$22.5K)
- Month 3 cumulative (+95%): $97,500 (+$47.5K)
- Month 6 cumulative (+320%): $210,000 (+$160K)
The goal isn't perfection—it's velocity. Build, test, learn, repeat.
Start with one variant this week. You'll be running a full experimentation program within 90 days.
--- About WE•DO Worldwide
We're a bolt-on marketing team running rapid experimentation programs that deliver 15-20 tests per month using AI-accelerated workflows. Our clients typically see 20-40% conversion improvements within 90 days. Learn more about our growth marketing services.
Ready to Transform Your Growth Strategy?
Let's discuss how AI-powered marketing can accelerate your results.