Website Speed & Technical SEO Jargon


Any and every website SEO audit will likely include website speed. According to Search Engine Land, Google has included site speed as a ranking factor since 2010*, so there isn’t anything new.
So why do so many sites ignore page speed? This article will break down some of the technical SEO jargon around page speed to help you better understand what is what.
By understanding some website speed terminology and concepts, you can maximize your ability to tackle the problem.
Here are the important site speed phrases we will dig into:
- TTFB
- Page Weight / Page Size
- Onload Time / Document Complete / Load Time
- Fully Loaded Time
- Number Of Requests
- Number Of Requests
- FCP – First Contentful Paint
- LCP – Largest Contentful Paint
- CLS – Cumulative Layout Shift
- Render Blocking
- Total Blocking Time
- Speed Index
Just a quick heads up. Before we dig in, here are a few places to run a website speed test. Your website score will be different across all of these. I know… it’s kinda annoying.
- Google PageSpeed Insights
- GTMetrix
- Pingdom Website Speed Test

TTFB – Time To First Byte
Time to first byte (TTFB) is the time it takes for your browser to receive the first byte of information from the webserver. This measurement is crucial because it can indicate how quickly the server can deliver information to the user. TTFB is often used as a metric to determine the overall speed of a website.
The smaller your TTFB number is, the better. Ideally, you want to see this number between 0.1 and 0.2 seconds. Keep in mind that you should be measuring this from the same country where your website server is located.
Not all hosting is created equal, and often, cheap hosting will see higher numbers here. You can see a performance bump by switching to a better website hosting provider.

Content Size / Page Size
Content Size or Page Size is the size of each file passing from your webserver to your users’ browser. You want this as small as possible. However, 4MB is the absolute maximum you want to be at for critical pages.
We tend to see images and WordPress plugins as the biggest offender here. Ensure that the images you use are not coming straight off your iPhone or Canon DSLR. They are far too big. Each image should be optimized (scaled to an appropriate size and stripped clean of metadata) to load quickly.
Larger files load slower, and Google doesn’t want to download each of your files every time it visits your page. This will affect your overall SEO for the page.

Onload Time / Load Time
Onload time is the time it takes for a page to be completely loaded. This includes all assets on the page, including images, scripts, and stylesheets. This time is often measured in seconds.
You want your onload time to be as fast as possible. The faster the onload time, the better the load time is essential because it’s one of the few website speed metrics that correlate with user experience. A study done by Amazon showed that even a 100-millisecond delay in onload time could result in a 1% decrease in sales.
A good onload time is around 2 seconds or less. Anything above 3 seconds is considered too slow. Based on a study by websitebuilderexpert.com, a 0.1-second natural mobile site speed improvement increased retail conversions by 8.4%.
Generally speaking, in WordPress, onload time is when the core files have loaded, but the third-party files haven’t completely loaded.

Fully Loaded Time
Fully Loaded Time is when the first contentful paint (FCP) has fired, onload has fired, and the network and CPU are idle. The calm after the storm.
This used to be a more important metric, but now it is more anecdotal since one script from an external tool might hold up the train. This isn’t really what the user sees. The majority of the page, if not all of the page, might be fully loaded from a user’s perspective, but there might be a piece of marketing script that is hung up in the background.

Number Of Requests
Generally speaking, Number Of Requests is the number of files or data requests that are downloaded on the page. The lower, the better for best SEO results. Ideally, under 50.
FCP – First Contentful Paint
First Contentful Paint is how quickly your content, like text and images shows up on your page.
A good user experience is under 0.9 seconds. Google wants to see this under 1.8 seconds to consider the site “good.”

LCP – Largest Contentful Paint
LCP – Largest Contentful Paint is how long it takes for the largest element of content (e.g., a hero image or background images) to show up on your page.
A good user experience is under 1.2 seconds. Google wants this under 2.5 seconds and 2.5-4 seconds is in the “needs improvement” range, and 4+ seconds is straight-up bad and will feel slow and affect your SEO and ranking position.

CLS – Cumulative Layout Shift
CLS is a new metric that attempts to measure how stable the page’s layout is during the loading and render process. Cumulative layout shift is how much your page’s layout shifts as it loads. A good user experience is a score of 0.1 or less.
I’m sure you’ve seen this before where a page feels like it’s jumping all around as it’s loading? This type of thing kills user experience and will lead to a higher bounce rate. Google’s target for CLS is under 0.1 – note this is a computed metric and not speed
Render Blocking
Avoidance of resource-blocking resources is a common phrase you’ll have seen if you’ve done any speed testing, such as “Avoid Render Blocking Resources.” The term is inelegant and implies something is wrong or out of place, but this isn’t the case. When a browser encounters a render-blocking resource, it has to pause rendering the page until the resource is downloaded.
Total Blocking Time
TBT is how long it takes between the First Contentful Paint (FCP) and when the main thread is free to do work. If your TBT is high, your page is “blocking” the main thread for too long and not allowing the user to interact with the page.

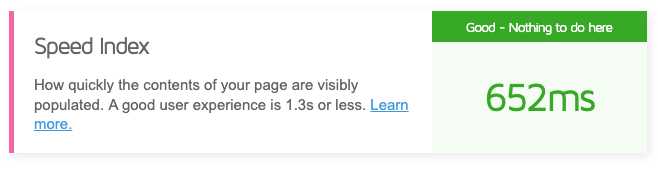
Speed Index
Speed Index is a metric that is calculated based on the visual differences between frames captured as your page is being loaded. In Google Pagespeed Insights, it’s about equivalent to Fully Loaded Time.
This score accounts for 10% of your total performance score in GTMetrix and is likely different for other tools.

Conclusion
Google has a need for speed and this should be part of your SEO efforts. The main takeaway is this; You can handle some items through content optimization (like text on the page and image optimization). These are low or no code items that you can easily fix. Other items may require code optimization by a developer or technical SEO agency. Use some of the tools at the top to help identify the important things on your website. This will help you figure out what speed optimization tasks you should tackle first.
*reference source: https://searchengineland.com/google-now-counts-site-speed-as-ranking-factor-39708
Fully transparent. Rapid testing. Growth minded.
Fully transparent. Rapid testing. Growth minded.
Schedule your 15-minute free consultation
WE•DO is ready to put our minds to work to drive your growth.
