GA4 has a data problem. Not too little data—too much.
The average GA4 property collects millions of events per month. Sessions, page views, scrolls, clicks, conversions, user properties, custom dimensions. The data exists. The insights hide.
Most marketing teams face the same challenge: they can pull reports, but they can't extract meaning. They know traffic went up 23%, but they don't know why. They see conversions dropped, but they can't pinpoint the cause. They have dashboards full of numbers that don't inform decisions.
The gap between data and insight is where most analytics efforts die.
We built AI-powered analytics workflows that bridge this gap—transforming raw GA4 data into actionable recommendations that drive revenue.
The Analytics Knowledge Gap
GA4 is powerful. It's also complex.
The shift from Universal Analytics introduced:
- Event-based data model (everything is an event)
- BigQuery integration (for those who can use it)
- Predictive metrics (that few understand)
- Custom dimensions and user properties (that require configuration)
- Exploration reports (with steep learning curves)
Most marketers learned Universal Analytics over years of practice. GA4 reset that knowledge to zero.
The result: teams have access to better data than ever before but less ability to use it.
The data exists. The knowledge to extract value doesn't.
The AI-Amplified Approach
Our analytics system doesn't replace GA4—it makes GA4 usable.
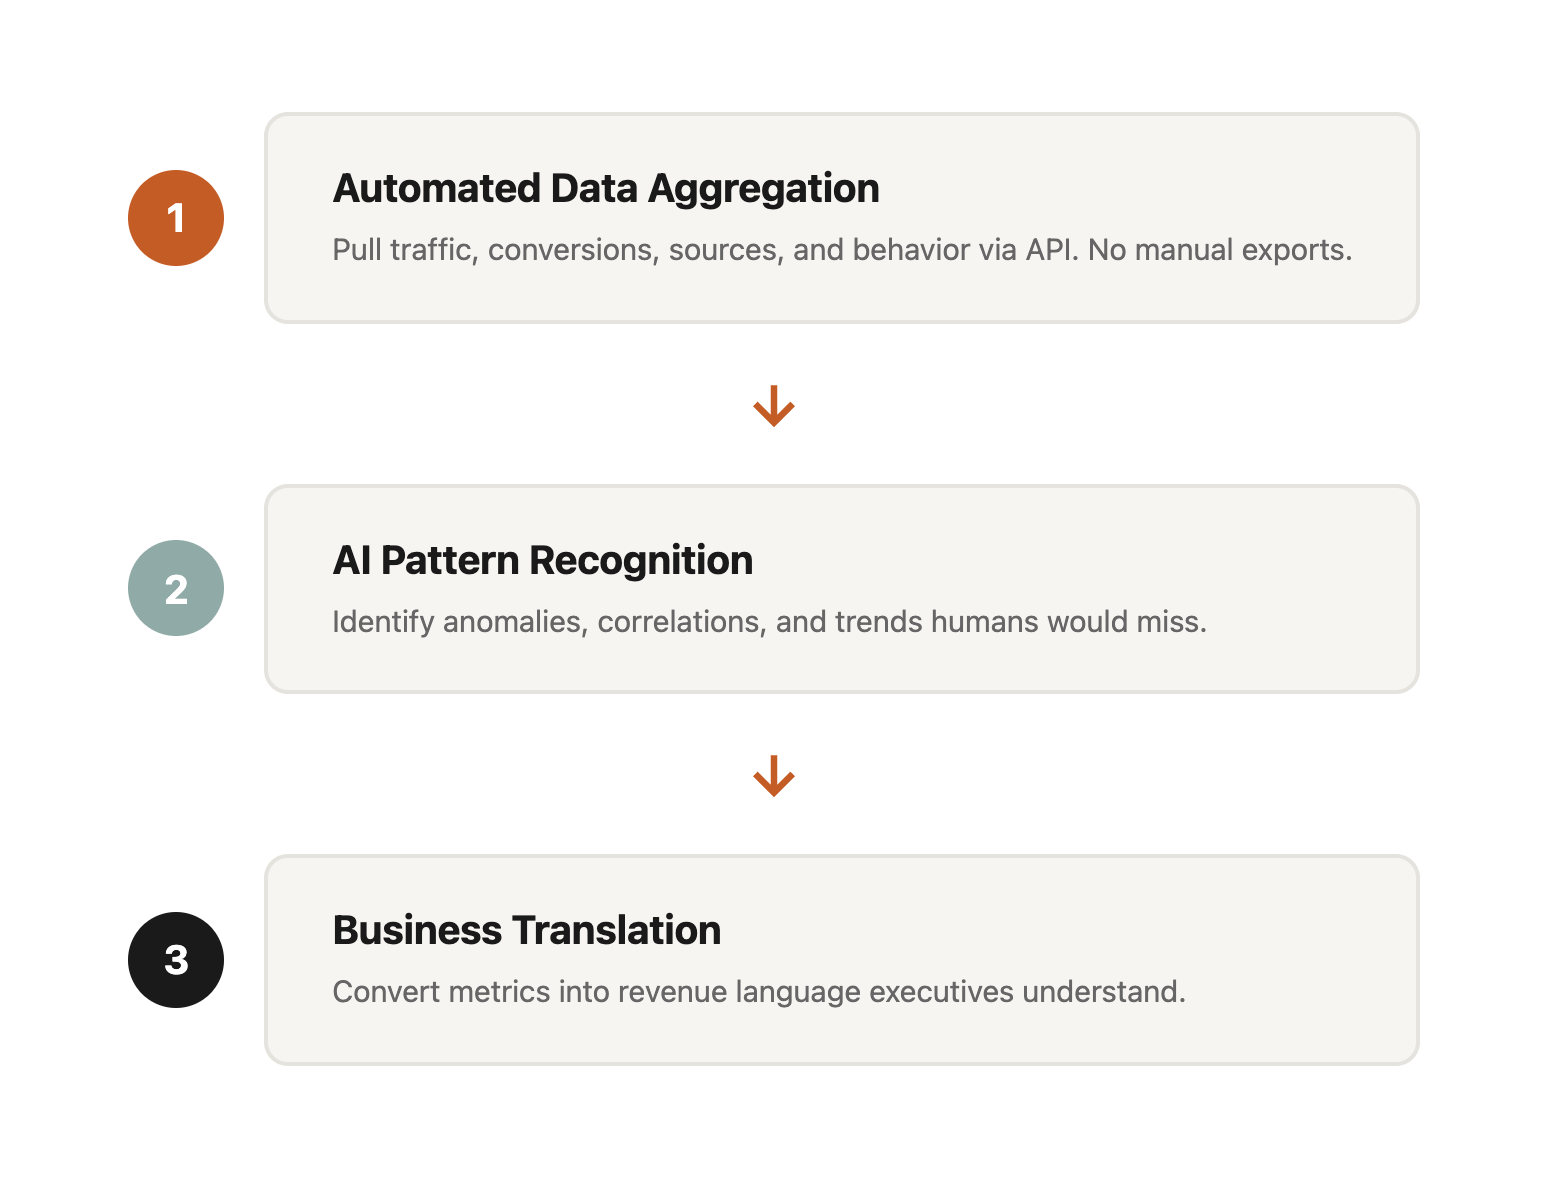
Component 1: Automated Data Aggregation
Manual reporting starts with logging into GA4, navigating to the right report, setting date ranges, and exporting data. For a comprehensive view, you repeat this across multiple reports, then cross-reference in spreadsheets.
Our system pulls data via the GA4 API:
Traffic metrics: Sessions, users, new users, engaged sessions, engagement rate, bounce rate Conversion data: All configured conversions with values Source attribution: Session source, medium, campaign for every conversion Page performance: Views, engagement time, entrances, exits by page User behavior: Events, scroll depth, outbound clicks, file downloads
Data arrives normalized and connected. No manual exports. No spreadsheet gymnastics.
Component 2: Pattern Recognition
Here's where AI transforms analytics.
Raw data: "Organic traffic increased 23% month-over-month."
AI-enhanced insight: "Organic traffic increased 23% MoM, driven primarily by three blog posts published in mid-December targeting [keyword cluster]. These posts generated 12,400 sessions (67% of organic growth) but converted at only 0.8% versus 2.1% site average. The content attracts informational-intent visitors who aren't purchase-ready. Recommend adding email capture CTAs to these posts to nurture this audience toward conversion."
The difference isn't just description versus prescription. It's connecting dots that humans don't have time to connect.
Anomaly detection: The system identifies when metrics deviate significantly from historical patterns. A 15% traffic drop that would be buried in a dashboard becomes a flagged alert with potential causes.
Correlation analysis: When conversion rate drops, what else changed? Traffic source mix? Landing page distribution? Device split? AI scans for correlating changes that explain the shift.
Trend identification: Not just "traffic increased" but "traffic has increased for three consecutive months, accelerating each month, primarily from organic search targeting [topic cluster]."
Component 3: Business Translation
GA4 speaks in metrics. Executives speak in revenue.
AI translates:
Technical: "Sessions from google/cpc increased 34% while CPA decreased 12%."
Business: "Google Ads generated $47,000 in attributed revenue this month, up from $38,000 last month. Cost efficiency improved—we're acquiring customers for $23 less each. At current trajectory, Q1 will exceed target by approximately $28,000."
Every metric connects to business outcomes. Every trend ties to revenue impact. Every recommendation includes expected value.
Component 4: Automated Narrative Generation
The monthly report used to require an analyst spending 8-12 hours: pulling data, building charts, writing analysis, formatting presentation.
Now:
Executive summary: AI generates a 3-paragraph overview highlighting the most important changes, their causes, and recommended actions.
Channel analysis: Each traffic source gets performance commentary with context and recommendations.
Page performance: Top pages, trending pages, and underperforming pages identified with specific optimization opportunities.
Conversion analysis: Funnel performance, drop-off points, and improvement opportunities quantified.
Human review takes 30-45 minutes. Adding strategic context and client-specific recommendations takes another 15-30 minutes. Total: under 90 minutes for a comprehensive monthly report. For more on our reporting process, see how we deliver 100 client reports per month.
Real Examples
Let me show you what this looks like in practice.
Example 1: Traffic Source Shift
Raw GA4 data:
- Organic: 45,230 sessions (+23%)
- Paid: 12,450 sessions (-8%)
- Direct: 18,920 sessions (+5%)
- Referral: 3,240 sessions (+67%)
AI analysis: "Traffic mix shifted significantly toward organic and referral sources. The 67% referral increase traces to a single source: a industry publication that featured your recent case study, generating 1,340 sessions with 4.2% conversion rate (2x site average). This high-intent referral traffic validates the case study content format—recommend producing one case study per month and pitching to industry publications.
Meanwhile, paid traffic decreased 8% despite stable spend, indicating declining ad efficiency. Click-through rate dropped from 3.2% to 2.7%, suggesting ad creative fatigue. Recommend refreshing ad creative and testing new headlines focused on [specific benefit mentioned in high-performing case study]."
Example 2: Conversion Rate Decline
Raw GA4 data:
- Conversion rate: 2.1% (down from 2.8%)
- Sessions: 78,450 (+12%)
- Conversions: 1,647 (down from 1,820)
AI analysis: "Conversion rate declined 25% despite traffic growth, resulting in 173 fewer conversions than last month. Investigation reveals:
- Mobile conversion rate dropped from 1.9% to 0.9% (53% decline)
- Mobile traffic share increased from 34% to 41%
- Mobile bounce rate increased from 52% to 68%
Cross-referencing with page speed data: mobile LCP (Largest Contentful Paint) degraded from 2.1s to 4.3s after the January 15 site update. The homepage hero image change introduced a 2.8MB unoptimized image that's crushing mobile performance.
Immediate action: Optimize hero image (compress to under 200KB, add lazy loading). Expected impact: recovering approximately 150 conversions per month within 2 weeks of fix deployment."
Example 3: Content Performance
Raw GA4 data:
- Blog sessions: 23,450
- Average engagement time: 2:34
- Scroll depth (90%+): 12%
AI analysis: "Blog engagement shows a bifurcated pattern:
High performers (8 posts, 34% of traffic):
- Average engagement: 4:12
- Scroll depth 90%+: 28%
- Email signup rate: 3.4%
Low performers (47 posts, 66% of traffic):
- Average engagement: 1:08
- Scroll depth 90%+: 4%
- Email signup rate: 0.2%
The 8 high-performing posts share characteristics: 2,000+ words, include data/statistics, feature custom graphics, and target specific long-tail keywords. The 47 low performers are shorter (under 800 words), lack visual elements, and target broad keywords with high competition.
Recommendation: Consolidate low-performing posts into comprehensive guides matching high-performer characteristics. Estimated impact: 40-60% increase in blog-attributed conversions within 90 days."
Building Your Analytics Intelligence
You can implement similar systems. Here's the framework.
Step 1: Define Business Questions
Before building reports, define what you need to know:
Traffic questions:
- Where is traffic coming from and how is the mix changing?
- Which sources deliver highest-value visitors?
- What content attracts traffic and does it convert?
Conversion questions:
- Where do users drop off in the conversion funnel?
- What distinguishes converters from non-converters?
- How does conversion vary by traffic source, device, and landing page?
Revenue questions:
- What's the true cost of customer acquisition by channel?
- Which products/services drive highest lifetime value?
- Where are the biggest revenue leakage points?
Step 2: Configure GA4 Properly
Most GA4 implementations miss critical configuration:
Essential events:
- Purchase/conversion events with value
- Lead form submissions
- Email signups
- Key page views (pricing, contact, product pages)
- Scroll depth (25%, 50%, 75%, 90%)
- Outbound link clicks
User properties:
- Customer type (new vs returning)
- Acquisition source (first touch)
- Engagement level (based on behavior)
Custom dimensions:
- Content category
- Author (for blogs)
- Product category
- User segment
Proper configuration is prerequisite to useful analysis.
Step 3: Implement API Integration
Manual data pulls don't scale. API integration enables:
- Scheduled data pulls (daily, weekly, monthly)
- Cross-property aggregation (if you have multiple GA4 properties)
- Historical trend analysis
- Automated anomaly detection
Options:
- Google Analytics Data API (direct integration)
- Supermetrics or similar connectors
- BigQuery export for advanced analysis
Step 4: Add AI Analysis Layer
Feed structured data to Claude, GPT-4, or similar with specific prompts:
Anomaly analysis prompt: "Here is this month's GA4 data compared to last month. Identify the three most significant changes, explain likely causes based on the data patterns, and recommend specific actions to address negative changes or capitalize on positive changes."
Executive summary prompt: "Summarize this GA4 data for a non-technical executive. Focus on business impact: revenue implications, customer acquisition efficiency, and strategic recommendations. Avoid jargon. Connect every metric to business outcomes."
Optimization prompt: "Based on this conversion funnel data, identify the highest-impact optimization opportunities. Rank by potential revenue impact and implementation difficulty. Provide specific, actionable recommendations for the top three opportunities."
Step 5: Establish Review Cadence
Data without action is worthless. Establish rhythms:
Daily: Automated anomaly alerts (significant deviations only) Weekly: Traffic and conversion trends review (15 minutes) Monthly: Comprehensive performance analysis (60-90 minutes) Quarterly: Strategic review with trend analysis and goal setting
Regular review creates accountability and ensures insights translate to action.
The Compound Effect
AI-powered analytics creates a flywheel:
Better insights lead to better decisions lead to better results lead to more data lead to better insights.
Each month, the system learns what matters for your business. Anomaly detection calibrates to your patterns. Recommendations incorporate what worked and what didn't.
After six months, your analytics system understands your business better than a new analyst would after six months of manual work. After a year, it has institutional memory that survives team turnover.
This is the real value: not just faster reporting, but compounding intelligence that gets smarter over time. This compounding improvement is central to our entire AI-amplified marketing approach.
Start Here
If you're drowning in GA4 data without extracting value, here's your path forward:
This week:
- Audit your GA4 configuration (are essential events tracked?)
- Define three business questions you need analytics to answer
- Pull one month of data and attempt manual analysis (baseline your current process)
This month:
- Implement missing event tracking
- Set up API access or connector tool
- Experiment with AI-assisted analysis on one report
This quarter:
- Automate weekly data pulls
- Build AI prompts for your specific analysis needs
- Establish review cadence with stakeholders
Let Us Build It For You
Don't want to build the system yourself? Our CRO & Analytics services deliver analytics intelligence without the setup complexity.
What you get:
- GA4 audit and configuration optimization
- Automated data aggregation and reporting
- AI-powered analysis with business translation
- Monthly strategic recommendations
- Quarterly business reviews
Investment: Starting at $1,500/month for comprehensive analytics intelligence.
Contact us:
- Email: hello@wedoworldwide.com
- Website: wedoworldwide.com
Tell us what business questions your data should answer. We'll show you how to get there.
About the Author: Mike McKearin is the founder of WE-DO Growth Agency. His team transforms GA4 data into revenue-driving insights for 100+ clients who used to drown in dashboards they couldn't interpret.