Client reporting is the bane of every agency's existence.
You know the drill. End of month hits. Account managers scramble to log into five different platforms—GA4, Search Console, Google Ads, email platform, social channels. Export data. Copy into spreadsheets. Build charts. Write analysis. Format in branded templates. Send to clients. Repeat 50 times.
A senior analyst spends 60% of their time on report production. That's 60% of a skilled employee's salary going toward mechanical data aggregation and formatting instead of strategic analysis that actually moves the needle for clients.
We faced the same problem. Then we solved it.
Today, a team of three delivers 100+ branded client reports per month. Not simplified dashboards. Full reports with data visualization, written analysis, and strategic recommendations. The kind of reports clients actually read and act on.
Here's exactly how we built this system.
The Traditional Reporting Nightmare
Let me quantify the problem.
A typical monthly performance report requires:
Five hours per report. Fifty clients. That's 250 hours of report production per month—more than one full-time employee doing nothing but reports.
And here's the real problem: those 250 hours don't include strategic thinking. They're pure mechanical work. Data aggregation, formatting, quality checking. A junior analyst can do it, but they'll burn out. A senior analyst can do it, but you're wasting their expertise.
We needed a different approach.
The AI-Amplified Reporting System
Our solution has three components: standardized templates, automated data aggregation, and AI-generated analysis. Each component cuts hours from the process.
Component 1: Standardized Templates with Flexibility
Every report starts from a template. But "template" doesn't mean "generic."
Our template system includes:
Structural consistency: Every report has the same sections in the same order. Executive summary, key metrics, channel performance, insights, recommendations, next steps. Clients know where to find information.
Visual consistency: Every report uses the same chart styles, color palettes, and typography. Professional appearance, zero design decisions required.
Content flexibility: Within the structure, content adapts to each client. E-commerce clients see revenue and conversion metrics. Lead-gen clients see form submissions and cost-per-lead. Content clients see traffic and engagement.
The key insight: standardization isn't about making every report identical. It's about standardizing decisions so humans focus on insights, not formatting.
We built 43 template types covering different report categories:
- Monthly performance reports (standard, executive, detailed)
- SEO audits (technical, content, competitive)
- PPC reports (Google Ads, Meta, LinkedIn)
- Content performance (blog, email, social)
- Conversion analysis (funnel, cohort, A/B test results)
- Strategic documents (roadmaps, proposals, competitive analysis)
Each template defines structure, required data points, visualization types, and narrative prompts. The template doesn't write the report—it removes 80% of the decisions.
Component 2: Automated Data Aggregation
Manual data exports are the biggest time sink in traditional reporting. Log into GA4. Navigate to the right report. Set the date range. Export CSV. Repeat for Search Console. Repeat for Google Ads. Repeat for email. Repeat for social.
Our system pulls data automatically via APIs:
Google Analytics 4: Sessions, users, page views, conversions, revenue, source/medium breakdown, landing page performance, device categories, geographic data.
Google Search Console: Impressions, clicks, CTR, average position, top queries, top pages, indexing status, Core Web Vitals.
Google Ads: Spend, clicks, conversions, CPA, ROAS, campaign performance, keyword performance, search terms.
Email platforms: Sends, opens, clicks, conversions, list growth, unsubscribes by campaign.
Data pulls happen on demand or on schedule. The system knows which client connects to which property IDs. Request a report, data appears—no manual exports.
Time saved: 45 minutes per report x 100 reports = 75 hours per month.
Component 3: AI-Generated Analysis
Data without analysis is noise. Charts without narrative don't tell clients what to do.
Traditional approach: Analyst stares at data, identifies patterns, writes analysis. 90 minutes per report.
AI-amplified approach: System identifies patterns, generates draft analysis, human refines and adds strategic context. 15 minutes per report.
Here's what the AI does:
Anomaly detection: "Organic traffic increased 34% month-over-month, significantly above the typical 5-10% variance. Primary driver: three blog posts published on [topic] generating 12,000 sessions."
Trend identification: "This is the third consecutive month of declining email open rates (32% → 28% → 24%). Pattern suggests list fatigue or deliverability issues. Recommend list hygiene audit."
Comparative analysis: "Conversion rate (2.8%) exceeds industry benchmark (2.1%) by 33%. However, average order value ($45) trails benchmark ($62) by 27%. Revenue optimization should focus on increasing AOV through upsells and bundles."
Recommendation generation: Based on patterns, the AI suggests actions: "Test new email subject line formats to address declining opens. Consider segmentation by engagement level. Implement re-engagement campaign for 90-day inactive subscribers."
The human reviews, refines, and adds context the AI can't know—client-specific priorities, historical context, relationship dynamics. But the first draft surfaces insights that would take 90 minutes to identify manually.
Time saved: 75 minutes per report x 100 reports = 125 hours per month. For more on turning raw GA4 data into actionable insights, see our guide on AI-powered analytics.
The Complete Workflow
Let me walk through exactly how a report goes from request to delivery.
Step 1: Report Request (2 minutes)
Account manager triggers report generation. They specify:
- Client name (auto-populates all property IDs and credentials)
- Report type (monthly performance, SEO audit, etc.)
- Period (January 2026, Q4 2025, etc.)
- Any custom notes (specific focuses, client requests)
The system matches client to template type, data sources, and branding. No configuration required—it's all stored in the client profile.
Step 2: Data Aggregation (5 minutes)
System pulls data from all connected sources in parallel:
- GA4 API for traffic and conversion metrics
- GSC API for search performance
- Ads API for paid metrics
- Email platform API for campaign data
Data normalizes into the template structure automatically. Charts generate with proper date ranges and comparison periods. Tables populate with the right metrics.
No spreadsheets. No copy-paste. No "which account was this again?"
Step 3: AI Analysis Generation (3 minutes)
With data in place, AI generates the narrative sections:
Executive summary: High-level performance overview, key wins, areas of concern.
Channel analysis: Performance breakdown by channel with context and causation.
Insights section: Pattern identification, anomaly explanation, trend analysis.
Recommendations: Suggested actions based on data patterns and client context.
The output isn't a finished report—it's a strong first draft that surfaces the story in the data.
Step 4: Human Review and Refinement (15-20 minutes)
The account manager reviews the generated report:
- Validates data accuracy (spot-check key metrics)
- Refines AI-generated narrative (add context, adjust tone)
- Adds strategic recommendations (connect to ongoing initiatives)
- Personalizes client-specific callouts (reference conversations, priorities)
This is the human value-add. The AI handled mechanical work; the human adds insight, judgment, and relationship awareness.
Step 5: Deployment (2 minutes)
Finished report deploys to a shareable URL. One click. No email attachments that get lost or versions that conflict.
Client receives a branded link: reports.wedoworldwide.com/clientname/jan-2026
They can view on any device, share with their team, reference later. Reports stay current if we update them (rare, but possible).
The system logs the report to our project management system—Notion in our case—creating an audit trail and institutional memory.
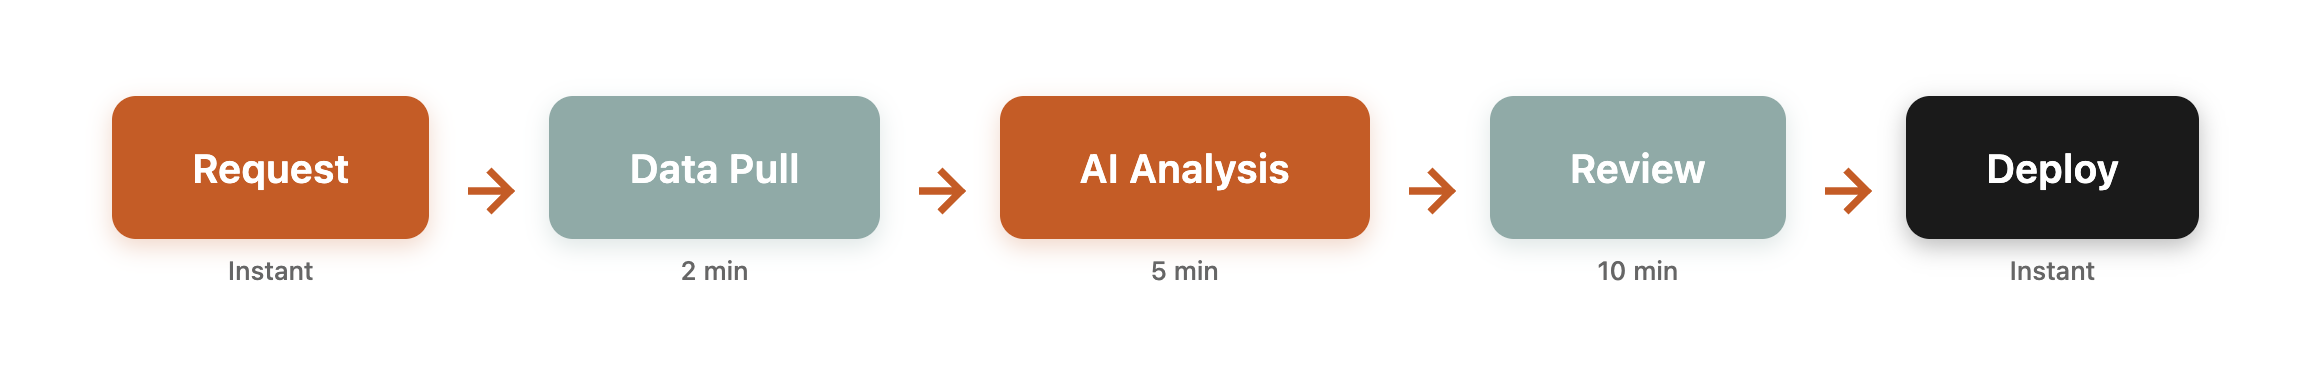
Total Time: 30 Minutes
From request to deliverable: 30 minutes.
Compare to 5 hours manual. That's a 10x improvement. And the output is higher quality because humans spend their time on analysis instead of data aggregation.
Scaling Without Scaling Headcount
Here's where the economics get interesting.
Traditional model:
- 100 reports x 5 hours = 500 hours/month
- 500 hours / 160 hours per FTE = 3.1 FTEs dedicated to reporting
- At $75K loaded cost per analyst = $232,500/year just for report production
AI-amplified model:
- 100 reports x 0.5 hours = 50 hours/month
- 50 hours spread across account team as part of client management
- No dedicated reporting headcount required
- Account managers spend 12 hours/month on reporting (vs. managing relationships)
The savings aren't just financial. They're strategic.
Account managers who spent 40% of their time on report production now spend that time on strategy, optimization, and client relationships. Client satisfaction improves because their contact is thinking about their business, not stuck in spreadsheets.
The team that used to handle 30 clients can handle 100. Not by working harder—by working smarter.
What Makes Reports Actually Useful
Speed and efficiency are great. But they're worthless if clients don't read the reports.
Here's what we learned about making reports clients actually value:
Insight Density Over Data Volume
Traditional reports suffer from data obesity. Forty pages of charts and tables that clients skim, looking for the one number that matters.
Our reports prioritize insight density. Every chart has a "so what?" Every data point connects to an action. If a section doesn't inform a decision, it doesn't belong.
Executive summary on page one. Key metrics with directional indicators. The most important insight in the first paragraph. Clients who only read 30 seconds get the critical information.
Narrative Over Numbers
Numbers without context are noise. "Sessions increased 23%"—compared to what? Why? What should we do about it?
Every metric in our reports includes:
- Comparison to prior period
- Comparison to same period last year (seasonality adjustment)
- Context for why the change happened
- Implication for strategy
"Sessions increased 23% MoM, compared to 5% typical variance. Primary driver: viral LinkedIn post on [topic] generated 8,400 referral sessions. This audience has lower conversion rate (0.8% vs 2.1% baseline) but higher engagement time. Recommend creating dedicated landing page for social traffic with newsletter CTA instead of purchase CTA."
That's actionable. That's worth reading.
Forward-Looking Over Backward-Looking
Historical reports tell you what happened. Useful, but limited. Clients want to know what to do next.
Every report concludes with:
Recommendations: Specific actions based on data patterns. "Increase budget for Campaign X by 20%—ROAS exceeds target and headroom remains."
Next steps: What we'll do this month. "Publishing three blog posts targeting [keywords]. Testing new email subject line format. Launching retargeting campaign for cart abandoners."
Questions for client: What we need from them. "Please confirm budget allocation for Q2. Do you want to proceed with the landing page test? Can you share updated inventory projections?"
Reports that end with action items get responses. Reports that end with charts get filed.
Consistent Delivery Cadence
Sporadic reporting destroys trust. If clients never know when reports arrive, they assume you're not paying attention.
Our system enforces cadence:
- Monthly reports deliver by the 5th of the following month
- Weekly highlights email on Monday mornings
- Quarterly reviews scheduled automatically
Consistency builds confidence. Clients know we're watching their data because they see evidence every week.
Building Your Own Reporting System
You don't need to build exactly what we built. But you can apply the same principles.
Principle 1: Standardize Structure
Decide what sections every report needs. Document the structure. Create templates that enforce it.
This isn't limiting creativity—it's channeling effort. Strategic thinking goes into client-specific insights, not debating whether metrics come before or after analysis.
Principle 2: Automate Data Aggregation
Manual exports are the enemy. Every minute spent logging into platforms and exporting CSVs is a minute not spent on analysis.
Options:
- API integrations: Build or buy connections to data sources
- Supermetrics/Agency Analytics: Third-party tools that aggregate marketing data
- Data studio alternatives: Looker Studio, Whatagraph, etc. automate visualization
Start with your most common report type. Automate data aggregation for that one report. Expand from there.
Principle 3: Use AI for First Drafts
AI won't write your final report. But it can write the first draft.
Feed data to Claude, GPT-4, or similar. Ask it to identify patterns, explain anomalies, and suggest recommendations. Use the output as starting point, not finished product.
Even crude AI drafts save 60% of writing time. The human adds judgment, context, and polish. But the mechanical work of turning data into words—AI handles that.
Principle 4: Make Delivery Frictionless
Email attachments get lost. PDFs don't update. Links to live reports solve both problems.
Options:
- Notion/Coda databases with client portals
- Google Sites with embedded Looker Studio
- Custom-built report hosting (what we use)
- Client portal features in agency management tools
The easier it is for clients to access reports, the more likely they are to read them.
The Compound Effect
Here's what happens when reporting becomes efficient:
More experiments: When you're not spending 5 hours per report, you have time to run additional analyses. "What if we looked at conversion by device and traffic source combined?" becomes possible instead of theoretical.
Faster insights: Monthly reports that arrive on the 5th (instead of the 20th) mean clients can act on insights while they're still relevant.
Deeper relationships: Account managers who aren't buried in spreadsheets have time for strategic conversations. "Here's what the data shows, and here's what I think it means for your Q2 goals."
Better retention: Clients who receive consistent, insightful, actionable reports stick around longer. They see evidence of value every month.
The reporting system isn't just about efficiency. It's about creating space for the work that actually matters. This is part of our broader AI-amplified marketing approach, powered by AI tools for business automation that connect data sources, generate analysis, and deliver results without manual bottlenecks.
Getting Started
If you're drowning in report production, here's your action plan:
This Week
- Time yourself producing one report. Document every step and how long it takes.
- Identify the biggest time sinks (probably data exports and formatting).
- Calculate: hours per report x reports per month = total monthly time sink.
This Month
- Standardize one report template. Structure, sections, required metrics.
- Evaluate one data aggregation tool. Supermetrics, Agency Analytics, or direct API.
- Experiment with AI-generated analysis drafts for three reports.
This Quarter
- Implement automated data aggregation for your top 5 clients.
- Build or adopt a delivery mechanism (live links, not attachments).
- Measure: time per report before vs. after. Calculate hours saved.
Ongoing
- Expand automation to all clients.
- Add report types (quarterly reviews, SEO audits, etc.).
- Continuously improve templates based on client feedback.
The goal isn't perfection on day one. It's progress. Every hour saved is an hour available for strategic work.
Let's Talk About Your Reporting
If you're spending more than an hour per client report, we should talk.
WE-DO can help in two ways:
Done-for-you: We manage your client reporting entirely. You provide client access; we deliver professional reports. Fixed per-client pricing, predictable costs, no headcount required on your side.
Consultation: We help you build internal reporting systems. Template design, data integration strategy, workflow optimization. You implement; we guide.
Either way, the goal is the same: get reporting off your team's back so they can focus on work that moves the needle. Automated reporting is a core component of our AI Integration services, and it's one of the reasons clients choose to work with an AI marketing agency rather than building reporting infrastructure in-house.
Contact us:
- Email: hello@wedoworldwide.com
- Website: wedoworldwide.com
Tell us: How many reports do you produce monthly? How long does each take? What would you do with 200 extra hours per month?
About the Author: Mike McKearin is the founder of WE-DO Growth Agency. His team delivers 100+ client reports per month using the AI-amplified system described in this article. He's unreasonably passionate about operational efficiency and slightly obsessed with eliminating unnecessary work.