This is a story about time.
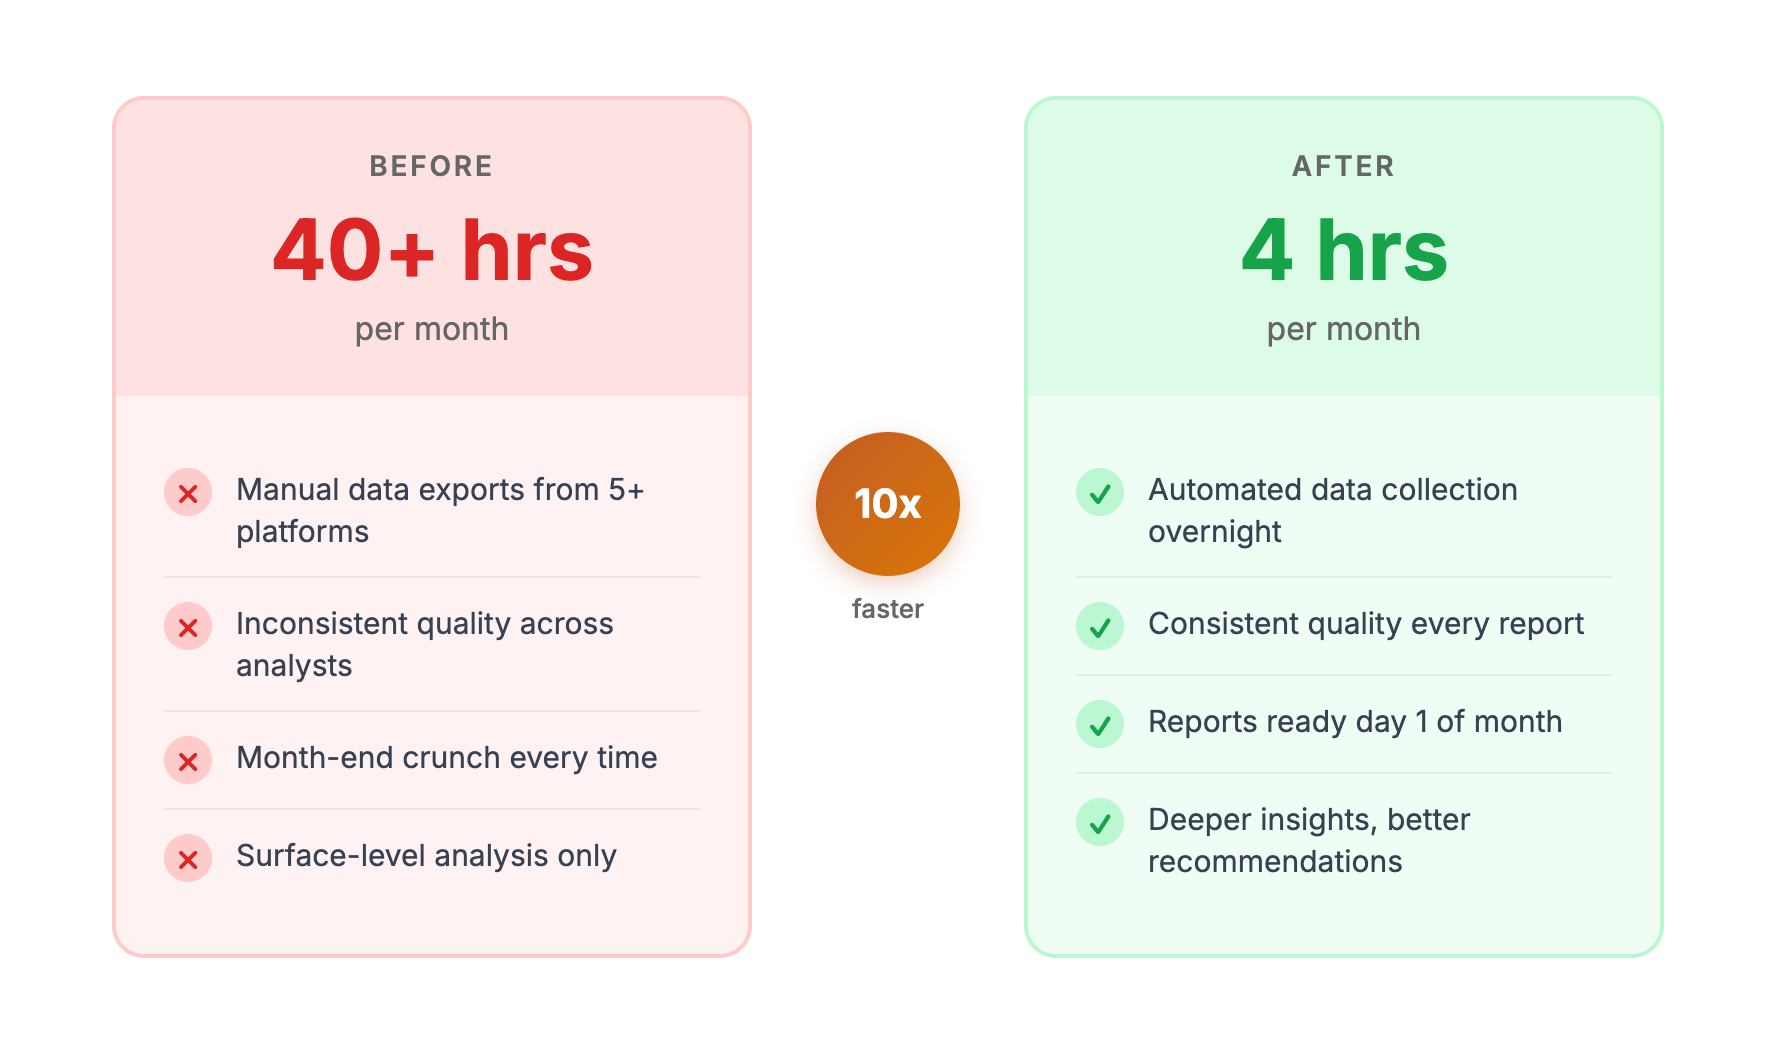
A B2B SaaS company's marketing team spent 40+ hours every month producing client reports. Skilled analysts logged into platforms, exported data, built spreadsheets, created charts, wrote analysis, and formatted documents. Repeat across 12 accounts.
Eight months later, the same team produces better reports in 4 hours. Not simpler reports—better ones. More analysis, deeper insights, more actionable recommendations.
Here's exactly how we did it, what we learned, and what you can apply to your own operations.
The Starting Point
The client was a B2B SaaS company with $15M ARR and an 8-person marketing team. They managed marketing for 12 internal business units, each requiring monthly performance reports.
The Reporting Reality
Each monthly report required:
Twelve reports × 5 hours = 60 hours of report production per month.
But the real number was worse. Two senior analysts spent most of their time on reporting, with overflow work creating delays and rushed analysis at month-end. Actual time including coordination and revisions: closer to 80 hours monthly.
The Real Problem
Hours weren't the only issue:
Quality inconsistency. Different analysts produced different quality work. Some reports had deep analysis; others were data dumps with minimal interpretation.
No time for strategy. Senior analysts—people capable of strategic thinking—spent their days doing data entry and formatting. Their expertise was wasted on mechanical work.
Month-end crunch. The first week of each month was chaos. Other projects stopped while everyone scrambled to complete reports.
Reactive analysis. Reports told what happened but rarely why or what to do about it. Insights were surface-level because there wasn't time to dig deeper.
The team knew this was broken. They'd tried dashboard tools (too shallow for stakeholder needs), better templates (still required manual data entry), and hiring (expensive and still didn't fix the core problem).
They needed a different approach.
Our Approach
We structured the engagement in four phases over 8 weeks.
Phase 1: Process Audit (Weeks 1-2)
Before building anything, we needed to understand exactly how reports were created.
What we did:
- Shadowed analysts through complete report creation
- Documented every step, decision point, and pain point
- Inventoried all data sources, credentials, and access
- Collected sample reports to understand quality expectations
- Identified which report elements were standard vs. custom
What we learned:
- 70% of time went to data aggregation—the least valuable work
- Quality variation came from narrative sections, not data
- Most "customization" was actually predictable patterns
- The real bottleneck wasn't tools—it was architecture
The insight: reports weren't complex, they were repetitive. The same work happened twelve times because nothing was systematized.
Phase 2: Architecture Design (Weeks 3-4)
With process understood, we designed the system.
Data layer:
- Direct API connections to GA4, GSC, Google Ads, HubSpot
- Scheduled data pulls running overnight before reports needed
- Standardized data formats regardless of source
- Automated period-over-period calculations
Template layer:
- Master template with consistent structure, branding, chart styles
- Dynamic sections that populated based on data
- Conditional content (show PPC section only for accounts with PPC)
- Placeholder system for narrative sections
Analysis layer:
- AI prompts trained on past report narratives
- Pattern recognition for anomalies (significant changes vs. normal variance)
- Benchmark comparison logic
- Recommendation generation based on data patterns
Output layer:
- Automated chart generation
- PDF export with correct formatting
- File naming and organization conventions
- Distribution automation (optional)
We documented everything before building. Architecture clarity prevented mid-project pivots.
Phase 3: Implementation (Weeks 5-8)
Building happened in stages, testing each component before adding the next.
Week 5: Data connections
- Connected all platforms via API
- Built data normalization layer
- Tested data accuracy against manual exports
- Set up scheduled pulls
Week 6: Template system
- Created master template with all standard sections
- Built chart generation from normalized data
- Implemented conditional logic for variable sections
- Tested with historical data
Week 7: AI analysis
- Trained analysis prompts on sample narratives
- Built anomaly detection logic
- Created recommendation engine
- Tested output quality against human-written analysis
Week 8: Integration and training
- Connected all components end-to-end
- Ran parallel process (new system + old process) for validation
- Trained team on new workflow
- Documented edge cases and exceptions
Phase 4: Optimization (Ongoing)
The initial system worked, but improvement continued:
- Refined AI prompts based on analyst feedback
- Added report types as needed (quarterly summaries, ad hoc analyses)
- Built quality scoring to catch issues automatically
- Created feedback loops for continuous improvement
The Results
Time Savings
Twelve reports: 60+ hours → 9 hours monthly.
With coordination overhead reduced, actual team time on reporting dropped from ~80 hours to ~12 hours monthly.
Quality Improvements
Consistency: Every report follows identical structure and formatting. No more quality variation between analysts.
Depth: With 80% of mechanical work automated, analysts spend their 45 minutes on the 20% that matters—interpreting data, adding context, refining recommendations.
Coverage: Automated analysis catches patterns humans missed due to time pressure. Anomaly detection flags issues that would have been overlooked.
Timeliness: Reports delivered 3-5 days faster. No more month-end crunch; reports generate throughout the first week with minimal effort.
Business Impact
Capacity recovered: Senior analysts now spend time on strategic projects—campaign optimization, new channel testing, competitive research.
Additional accounts: Team took on 4 new accounts without hiring. The 68 hours recovered monthly absorbed the additional workload.
Stakeholder satisfaction: Faster delivery, consistent quality, and deeper insights improved internal client relationships.
Team morale: Analysts stopped dreading month-end. The work became about thinking, not typing.
What Made It Work
Reflecting on the engagement, several factors determined success:
Executive buy-in from day one
The VP of Marketing sponsored the project and protected time for participation. When analysts needed to shadow us during the audit phase, their other work was deprioritized.
Dedicated participation
Two analysts committed 2-4 hours/week during implementation. They knew the edge cases, validated outputs, and caught problems we wouldn't have noticed.
Willingness to standardize
Not every report was unique anymore. The team accepted that 90% standardization with 10% customization was better than 100% custom work that took 10x longer.
Patience during parallel process
Running old and new systems simultaneously for two weeks felt wasteful, but it built confidence. Stakeholders saw identical outputs, proving the new system worked before the old one was retired.
Realistic expectations about AI
AI wrote first drafts, not final products. Humans reviewed every output. We positioned this as "AI does the mechanical work; humans do the thinking work." No one felt replaced.
What We'd Do Differently
Perfect is fictional. Here's what we'd improve:
Start with fewer report types
We built all 12 account templates simultaneously. Should have started with 3-4, proven the approach, then expanded. The parallel complexity created avoidable stress.
More training on prompt refinement
Analysts needed to tweak AI prompts for their specific accounts. We underestimated how much training that required. Should have built prompt adjustment into the workflow from the start.
Establish feedback loop earlier
Formal feedback collection started in week 8. Should have started in week 6. Some issues we caught late could have been fixed sooner.
Document exceptions more thoroughly
Edge cases appeared that the system didn't handle well. Better documentation of what triggers manual intervention would have reduced confusion.
Can This Work for You?
This approach works when:
You produce similar deliverables repeatedly. Reports, audits, briefs, proposals—anything with consistent structure but variable data.
Multiple data sources need consolidation. If you're logging into 3+ platforms to create one deliverable, automation pays off.
Human time is the constraint. When skilled people spend hours on mechanical work, you're wasting their capacity.
Quality varies by person or circumstance. Systematization enforces consistency that human processes struggle to maintain.
This approach struggles when:
Every deliverable is unique. If there's no pattern, there's nothing to systematize.
Data access is fragmented. No API access = no automation. Some platforms don't play nice.
Volume is too low. Building systems for 2 reports/month doesn't make sense. The threshold is roughly 10+ similar deliverables monthly.
The team won't change. New systems require new habits. Resistance to change undermines implementation.
Getting Started
If this resonates with your situation:
Step 1: Audit your current process
- What deliverables consume the most time?
- What percentage is mechanical vs. thinking work?
- Where does quality vary?
- What data sources are involved?
Step 2: Calculate the opportunity
- Hours/month on mechanical work × hourly fully-loaded cost = monthly waste
- Multiply by 12 for annual cost
- Compare against implementation investment
Step 3: Start small
Pick one deliverable type. Build the system. Prove it works. Expand from there.
Step 4: Get help if needed
Building AI-powered systems requires skills your team may not have. Whether that's an agency, consultant, or new hire—get expertise if you don't have it internally.
This case study illustrates the approach we detailed in how we deliver 100 client reports without a reporting team. For the broader context on AI-amplified marketing, see our complete guide. If you're exploring whether an AI marketing agency can deliver similar transformations for your team, or want to understand the full landscape of using AI for marketing, those guides are a good starting point.
Interested in exploring whether a similar transformation could work for your operations? Let's have a conversation about your specific situation.