You've implemented AI tools across your marketing stack. ChatGPT writes first drafts. Zapier connects your workflows. Claude analyzes performance data. But here's the question that keeps executives up at night: Are we actually getting a return on this investment?
Most marketing teams can't answer this question with confidence. They track vanity metrics—"We generated 50 blog posts this month with AI!"—but can't connect those outputs to revenue, time savings, or competitive advantage.
This guide provides a comprehensive framework for measuring real ROI from AI marketing automation. You'll get attribution models, cost analysis templates, and benchmarks for evaluating whether your AI investments are paying off.
Why AI Marketing ROI Is Different
Traditional marketing ROI is straightforward: You spend $10,000 on paid ads and generate $50,000 in revenue. That's a 5x return. Simple math.
AI marketing ROI is more complex for three reasons:
1. Blended Cost Structures
AI tools charge by usage (API calls), subscription tiers, and implementation hours. A single campaign might involve:
- Claude API costs for content generation
- ChatGPT subscription for team access
- Developer time for automation setup
- Human editor time for quality control
Here's what a typical mid-market marketing team's AI cost structure looks like:
The challenge: Unlike paid ads where you can clearly see $10k in → $50k out, AI costs are distributed across tools, labor, and time investments that compound differently.
2. Indirect Value Creation
AI rarely drives direct revenue. Instead, it creates capacity (your team can do more), improves quality (better targeting, messaging), or reduces errors (consistent brand voice).
Consider this real example from a WE•DO client in the SaaS space: They implemented Claude for content generation, which didn't directly generate revenue. But the time savings allowed their content manager to launch a weekly newsletter that now drives 180 qualified leads per month. The AI tool cost $200/month. The newsletter generates $90,000 in pipeline value monthly.
The AI didn't create the leads—but it created the capacity that made the newsletter possible. This indirect value creation is why traditional ROI formulas fail for AI investments.
Value Creation Comparison:
3. Compound Effects
AI tools get more valuable over time as your team builds prompts, workflows, and institutional knowledge. The ROI in month 12 looks very different from month 1.
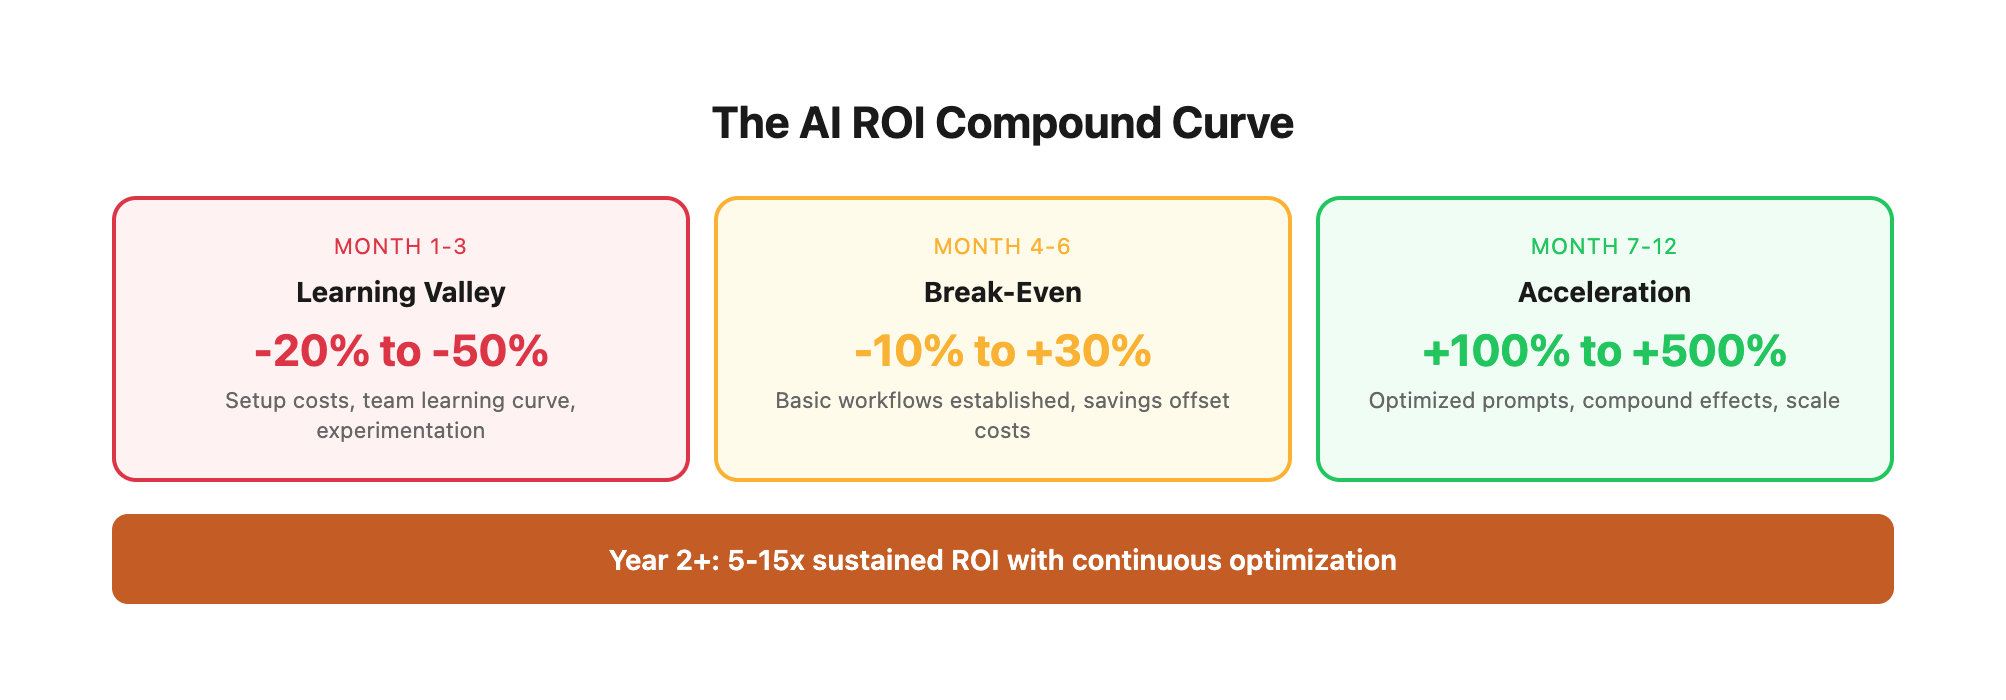
Here's the typical AI value curve we see across implementations:
The AI ROI Compound Curve:
Month 1-3: NEGATIVE ROI (Learning Curve Valley)
├─ Setup costs, implementation labor
├─ Team learning curve slows initial productivity
├─ Experimentation with prompts and workflows
└─ Typical ROI: -20% to -50%

Month 4-6: BREAK-EVEN ZONE (Efficiency Plateau)
├─ Basic workflows established and functioning
├─ Team proficiency improving rapidly
├─ Time savings start to offset costs
└─ Typical ROI: -10% to +30%

Month 7-12: ACCELERATION PHASE (Value Amplification)
├─ Optimized prompts and proven workflows
├─ Quality improvements show in conversion data
├─ New initiatives launched with freed capacity
└─ Typical ROI: +100% to +250%

Month 13+: STRATEGIC ADVANTAGE (Competitive Moat)
├─ AI capabilities embedded in core processes
├─ Speed and quality advantages vs. competitors
├─ Institutional knowledge creates unique value
└─ Typical ROI: +300% to +500%
Real Example—Content Marketing Team:
A B2B software company implemented AI content generation in January 2024:
- Month 1 ROI: -$3,200 (implementation costs, slow adoption)
- Month 3 ROI: -$800 (still learning optimal prompts)
- Month 6 ROI: +$2,400 (workflows established, time savings measurable)
- Month 9 ROI: +$8,600 (quality improvements driving conversions)
- Month 12 ROI: +$14,200 (capacity expansion enabled new content channels)
By December, the same $2,000/month AI investment was delivering 7x returns. The tools didn't change—the team's proficiency and workflow optimization drove exponential gains.
The Five-Layer ROI Framework
This framework breaks AI marketing ROI into five measurable layers, from tactical efficiency to strategic advantage.
Layer 1: Direct Cost Savings
What You're Measuring: Time and money saved by replacing manual tasks with AI automation.
How to Calculate:
Monthly Cost Savings = (Hours Saved × Hourly Rate) - AI Tool Costs

Example:
*   AI writes 20 blog post drafts per month
*   Each draft saves 2 hours of writer time (40 hours saved)
*   Writer hourly rate: $75/hour
*   AI tool costs: $200/month (Claude API + ChatGPT)

Monthly Savings = (40 hours × $75) - $200 = $2,800
Annual ROI = $2,800 × 12 = $33,600
Comprehensive Task-Based Time Savings Analysis:
Cost Analysis at Different Labor Rates:
Minus typical AI tool costs: $2,000/month ($24,000/year)
Net Annual Savings Range: $56,946 - $290,790 depending on team composition
What to Track:
- Time Logs: Document hours spent on tasks before and after AI implementation
- Task Completion Rates: Volume of work completed per team member
- Tool Costs: API usage, subscriptions, implementation hours
- Reallocation Evidence: Where saved time actually went (new projects, strategy work, etc.)
Task Tracking Template:
WEEKLY TIME SAVINGS LOG

Task: Blog Post Creation
Manual Process Time: 3.0 hours
AI-Assisted Time: 0.5 hours (generation) + 0.3 hours (editing) = 0.8 hours
Net Time Saved: 2.2 hours
Quality Rating: 4/5 (minor edits needed)
Reallocated To: Newsletter strategy planning

Task: Email Campaign Copy
Manual Process Time: 2.5 hours
AI-Assisted Time: 0.4 hours (generation) + 0.6 hours (editing) = 1.0 hours
Net Time Saved: 1.5 hours
Quality Rating: 5/5 (minimal edits)
Reallocated To: Customer segmentation analysis
Common Mistakes:
Don't count time "saved" if that time isn't reallocated to revenue-generating activities. If your writer spends the saved hours scrolling LinkedIn instead of creating strategy, you haven't actually saved anything.
The Reallocation Test: For every hour "saved" by AI, document what that hour was used for instead. If you can't identify high-value work that filled that time, you haven't generated real ROI—you've just created slack in the system.
Real Case Study—E-commerce Company:
A mid-size e-commerce brand implemented AI for product description writing:
Before AI:
- Content writer spent 40 hours/month writing descriptions
- Output: 80 products/month
- Cost: $3,200/month (writer salary allocation)
After AI Implementation:
- AI generation: 8 hours/month (setup, review, editing)
- Output: 200 products/month (2.5x increase)
- Tool costs: $150/month (API usage)
- Writer reallocated 32 hours to category page optimization
Direct ROI:
- Labor savings: 32 hours × $80/hr = $2,560
- Tool costs: -$150
- Net monthly savings: $2,410
- Annual savings: $28,920
Plus indirect benefits:
- Category page optimization increased organic traffic 34%
- More products published faster = faster time-to-revenue
- Writer satisfaction increased (more strategic work, less repetitive tasks)
Layer 2: Quality Improvements
What You're Measuring: Revenue impact from better outputs—higher conversion rates, improved engagement, fewer errors.
How to Calculate:
Quality Impact = Revenue Increase × Attribution %

Example:
*   AI-optimized email campaigns increase conversion rate from 2.1% to 2.8%
*   Monthly email revenue before: $50,000
*   Monthly email revenue after: $66,666 (+$16,666)
*   Attribution to AI optimization: 70%

Monthly Quality Impact = $16,666 × 0.70 = $11,666
Annual ROI = $11,666 × 12 = $139,992
Quality Improvement Metrics Across Channels:
Revenue Impact Analysis:
Here's how small quality improvements compound into significant revenue:
At scale, a half-point conversion improvement = $120K - $1.2M annual revenue impact.
What to Track:
- Conversion Rate Changes: Before/after AI implementation across all channels
- Engagement Metrics: Email open rates, click rates, time on page, scroll depth
- Error Reduction: Fewer campaigns requiring emergency fixes, typos, broken links
- Customer Satisfaction Scores: If AI improves customer-facing content
- Quality Score Improvements: For paid advertising (directly reduces costs)
Quality Attribution Framework:
Not all quality improvements come purely from AI. Use this attribution model:
Key Insight:
Quality improvements often dwarf cost savings. A 0.5% conversion rate increase on a high-volume channel delivers more value than 100 hours of saved labor.
Real Case Study—SaaS Company Email Optimization:
A B2B SaaS company with 80,000-person email list implemented AI for subject line and body copy optimization:
6-Month Quality Improvement Results:
Monthly Revenue Impact (Month 6):
- Sends per month: 320,000 emails (4 campaigns × 80K list)
- Revenue before AI: $134,400
- Revenue after AI: $198,400
- Increase: $64,000/month
- Attribution to AI: 75% (human strategy + AI execution)
- AI-attributed revenue: $48,000/month
Annual Impact: $576,000 additional revenue AI Tool Costs: $2,400/year ROI: 240x return
The key: AI didn't just save time—it made better marketing decisions at scale through multivariate testing of hundreds of subject line and copy variations.
Layer 3: Capacity Expansion
What You're Measuring: New initiatives made possible because AI freed up bandwidth. How to Calculate:
```
Capacity Value = Revenue from New Initiatives × Time Allocation %
Example:
- AI automation frees up 15 hours/week for your content manager
- They launch a newsletter that generates 50 leads/month
- Lead value: $500
- Time allocation to newsletter: 60% of freed hours
Monthly Capacity Value = (50 leads × $500) × 0.60 = $15,000
Annual ROI = $15,000 × 12 = $180,000
```
What to Track:
- New Channel Launches: Newsletters, podcasts, social platforms enabled by AI
- Increased Campaign Volume: More tests, variants, audiences reached
- Strategic Project Completion: Brand refreshes, research initiatives, competitive analysis
Critical Question:
What high-value activities was your team not doing before AI implementation? This is where transformational ROI lives.
Layer 4: Speed to Market
What You're Measuring: Competitive advantage and opportunity capture from faster execution. How to Calculate:
This layer is harder to quantify but often the most valuable. Consider:
- First-Mover Advantage: Launching campaigns before competitors
- Trend Capitalization: Creating content around breaking news within hours
- Response Time: Faster reaction to market changes, customer feedback
Example Framework:
```
Speed Value = (Opportunities Captured × Opportunity Value) - (Opportunities Captured Without AI × Opportunity Value)
Example:
- AI enables 3 trend-based campaigns per month (vs. 1 without AI)
- Each successful trend campaign generates $8,000 in revenue
- Success rate: 40%
Without AI: 1 × 0.40 × $8,000 = $3,200/month
With AI: 3 × 0.40 × $8,000 = $9,600/month
Speed Value = $9,600 - $3,200 = $6,400/month
Annual ROI = $6,400 × 12 = $76,800
```
What to Track:
- Campaign Launch Time: Time from concept to execution
- Response Time Metrics: How quickly you capitalize on trends, news, opportunities
- Competitive Timing: Did you launch first, second, or last?
Layer 5: Strategic Insights
What You're Measuring: Value of data analysis, customer insights, and competitive intelligence generated by AI. How to Calculate:
This is the least tangible but potentially most valuable layer. AI tools like Claude can analyze thousands of customer reviews, identify patterns in campaign performance, or synthesize competitive research in minutes instead of days.
Valuation Framework:
- Research Replacement Cost: What would this analysis cost from an agency or consultant?
- Decision Impact: What revenue decisions were improved by AI-generated insights?
- Risk Reduction: What mistakes were avoided due to AI analysis?
Example:
Your team uses Claude to analyze 5,000 customer support tickets, identifying three major pain points that inform your next product launch. That product generates $200,000 in first-year revenue. How much of that success is attributable to the AI analysis? Even if you conservatively attribute 10%, that's $20,000 in insight value.
Implementation: Your 90-Day ROI Tracking Plan
Here's how to implement this framework without creating administrative overhead.
Month 1: Baseline Documentation
Week 1-2: Pre-AI Measurement
Document current state before implementing AI:
- Time spent on key tasks (content creation, data analysis, campaign setup)
- Current conversion rates, engagement metrics
- Team capacity and project completion rates
Week 3-4: Tool Selection and Setup
- Choose AI tools based on specific use cases
- Set up tracking infrastructure (time logs, performance dashboards)
- Establish cost tracking (API usage monitoring, subscription accounting)
Month 2: Implementation and Initial Measurement
Week 5-8: Controlled Rollout
- Implement AI for specific tasks, not everything at once
- Run parallel processes (AI + manual) to compare quality
- Log actual time savings and cost comparisons
Key Metrics:
- Hours saved per task
- Quality comparison scores (AI output vs. manual)
- Team adoption rates
Month 3: Analysis and Optimization
Week 9-12: ROI Calculation
Calculate ROI across all five layers:
1. Direct Cost Savings: Hours saved × hourly rate - tool costs
2. Quality Improvements: Revenue impact from conversion rate changes
3. Capacity Expansion: Value of new initiatives launched
4. Speed to Market: Competitive advantages captured
5. Strategic Insights: Value of analysis and intelligence
Create a Monthly ROI Dashboard:
```
EXECUTIVE AI ROI DASHBOARD - [Month]
Total AI Investment: $X,XXX
━━━━━━━━━━━━━━━━━━━━━━━━━━━━━━
LAYER 1: Cost Savings
- Time saved: XX hours
- Labor cost avoided: $X,XXX
- Net savings: $X,XXX
LAYER 2: Quality Impact
- Conversion rate improvement: +X.X%
- Revenue impact: $XX,XXX
- Attribution to AI: XX%
LAYER 3: Capacity Expansion
- New initiatives launched: X
- Leads generated: XXX
- Revenue value: $XX,XXX
LAYER 4: Speed Advantage
- Campaign launch time reduction: XX%
- Trend captures: X
- Estimated value: $X,XXX
LAYER 5: Strategic Insights
- Analysis projects completed: X
- Decision impact: High/Medium/Low
- Estimated value: $X,XXX
━━━━━━━━━━━━━━━━━━━━━━━━━━━━━━
TOTAL MONTHLY ROI: $XX,XXX
ROI MULTIPLE: X.Xx
```
Common ROI Pitfalls and How to Avoid Them
Pitfall 1: Measuring Activity Instead of Outcomes
The Mistake: "We generated 200 social posts with AI this month!" Why It's Wrong: Volume without quality or engagement is worthless. If those 200 posts generate zero clicks, comments, or conversions, you've wasted AI costs and the time spent reviewing and publishing them. Fix: Track engagement and conversion metrics, not just output volume.
Pitfall 2: Ignoring Quality Control Costs
The Mistake: Calculating time savings without accounting for review, editing, and quality assurance. Why It's Wrong: AI output requires human oversight. If your "2-hour blog post" takes 1.5 hours of editing and fact-checking, your actual time savings is 30 minutes, not 2 hours. Fix: Log total time including review and editing, not just generation time.
Pitfall 3: Cherry-Picking Success Stories
The Mistake: Calculating ROI based on your best-performing AI applications while ignoring failed experiments. Why It's Wrong: True ROI includes all costs—successful tools and abandoned experiments. Fix: Track portfolio-level ROI across all AI initiatives, including failures.
Pitfall 4: Not Tracking Opportunity Cost
The Mistake: Celebrating time savings without measuring what that time was reallocated to. Why It's Wrong: If saved time goes to low-value activities (or isn't used at all), you haven't generated real ROI. Fix: Document what high-value activities increased due to AI capacity gains.
Industry Benchmarks: What Good ROI Looks Like
Based on implementations across WE•DO clients and industry research, here's what realistic AI marketing ROI looks like:
Year 1: Breaking Even to 2x
Realistic Expectations:
- Months 1-3: Negative ROI (implementation costs, learning curve)
- Months 4-6: Breaking even (efficiency gains offset costs)
- Months 7-12: 1.5-2x ROI (team proficiency improves)
Year 1 Performance Benchmarks by Team Size:
What Drives Success:
- Focused implementation (3-5 high-impact use cases, not 20)
- Strong training and change management
- Committed leadership support
- Weekly ROI reviews and rapid iteration
Common Year 1 Failure Patterns:
Year 2: 3-5x Returns
What Changes:
- Team proficiency with AI tools increases dramatically
- Workflows are optimized and automated
- Compound effects from quality improvements and capacity expansion
- Strategic advantages from faster execution
Year 2 Maturity Progression:
Key Metric:
High-performing teams see AI reduce time-to-execution by 40-60% while improving output quality by 20-30%. This combination drives exponential ROI.
Year 2 Performance Benchmarks by Industry:
Year 3+: Strategic Differentiation
AI becomes a competitive moat:
- Your team can execute at a level competitors can't match
- Speed advantages create first-mover benefits
- Quality consistency strengthens brand reputation
- Insights from AI analysis inform strategic decisions
At this stage, ROI calculation becomes less about individual tools and more about organizational capability.
Year 3+ Competitive Advantages:
Real Example—3-Year AI Transformation:
A mid-market B2B company tracked their AI journey from 2022-2025:
Total 4-Year Investment: $108,000 Total 4-Year Value Created: $693,000 Cumulative ROI: 6.4x
By 2025, their AI capabilities enabled:
- 3x content output with same team size
- 45% faster time-to-market than competitors
- 28% higher conversion rates from AI-optimized campaigns
- Two team members promoted due to strategic work enabled by AI
- Market perception as innovation leader in their space
The key insight: Year 1 was about efficiency. Year 2 was about effectiveness. Year 3+ became about competitive positioning that compounds annually.
Tools and Templates
ROI Tracking Spreadsheet
Create a comprehensive monthly tracking system. Here's the complete structure:
Complete ROI Tracking Spreadsheet Structure:
Downloadable Template Structure (CSV format):
Tool/Use Case,Subscription,API Cost,Impl Hours,Hourly Rate,Total Cost,Hours Saved,Time Value,Conv Before,Conv After,Revenue,Rev Increase,Attribution,Quality Value,Capacity Value,Total Value,Net ROI,ROI Multiple
Claude - Blog Content,$200,$150,4,$125,$850,32,$4000,2.3%,2.8%,$50000,$10870,70%,$7609,$5000,$16609,$15759,19.5x
ChatGPT - Email Copy,$20,$0,2,$125,$270,12,$1500,18.2%,21.4%,$25000,$4396,80%,$3517,$2000,$7017,$6747,26.0x
Monthly Tracking Dashboard Format:
━━━━━━━━━━━━━━━━━━━━━━━━━━━━━━━━━━━━━━━━
AI MARKETING ROI DASHBOARD - January 2025
━━━━━━━━━━━━━━━━━━━━━━━━━━━━━━━━━━━━━━━━

INVESTMENT SUMMARY
├─ Total AI Tool Costs: $1,850
├─ Implementation Labor: $1,200
├─ Training & Support: $400
└─ TOTAL INVESTMENT: $3,450

VALUE CREATED
├─ Time Savings (124 hrs): $15,500
├─ Quality Improvements: $18,240
├─ Capacity Expansion: $12,000
├─ Speed Advantage: $6,500
└─ TOTAL VALUE: $52,240

PERFORMANCE METRICS
├─ Net Monthly ROI: $48,790
├─ ROI Multiple: 15.1x
├─ Cost Per Hour Saved: $27.82
└─ Value Per Dollar Invested: $15.14

TOP PERFORMERS
1. Email Optimization (26.0x ROI)
2. Blog Content Generation (19.5x ROI)
3. Social Media Automation (12.3x ROI)

AREAS FOR IMPROVEMENT
1. Ad Copy Testing (2.1x ROI) - Need better prompts
2. Video Script Writing (0.8x ROI) - Consider discontinuing

NEXT MONTH PRIORITIES
→ Scale email optimization workflows
→ Improve ad copy prompt engineering
→ Test AI for landing page copy
━━━━━━━━━━━━━━━━━━━━━━━━━━━━━━━━━━━━━━━━
Attribution Framework
Not all outcomes are 100% attributable to AI. Use this framework:
100% Attribution:
- Direct time savings (AI did the work vs. human)
- Clear A/B test results (AI version vs. control)
70% Attribution:
- Quality improvements with multiple contributing factors
- AI-assisted campaigns with human strategy input
50% Attribution:
- Capacity gains where AI enabled but didn't directly create value
- Strategic insights that informed decisions
30% Attribution:
- Indirect impacts where AI was one of many factors
Monthly Review Meeting Agenda
15-Minute AI ROI Check-In (Monthly Team Meeting)
1. Cost Review (3 minutes)
- Total AI spend this month - Any unexpected costs or overages
2. Wins Documentation (5 minutes)
- Biggest time savings - Quality improvements with metrics - New capabilities enabled
3. Challenges and Adjustments (5 minutes)
- What's not working - Tools to add or remove - Training needs
4. Next Month Targets (2 minutes)
- Specific ROI goals - New use cases to test
When AI Isn't Worth It
Not every use case delivers positive ROI. Here are clear signals to reduce or eliminate AI tools:
Kill the Tool If:
- Consistent negative ROI after 6 months of optimization attempts
- Quality consistently requires more editing than writing from scratch
- Team refuses to adopt despite training and support
- Use case complexity creates more problems than it solves
Decision Matrix: Should You Keep This AI Tool?
Real Kill/Keep Examples from WE•DO Clients:
Example: One WE•DO client tested AI for generating technical product descriptions. After 3 months, the editing time to fix technical inaccuracies exceeded the time to write from scratch. We killed the use case and reallocated that AI budget to blog content generation, where ROI was 4x higher.
The Pivot Framework:
When a use case underperforms, follow this decision tree:
AI Tool Underperforming (<1x ROI after 3 months)
│
├─ Is quality the issue?
│  ├─ YES → Try better prompts, examples, constraints
│  │        If no improvement in 4 weeks → KILL
│  │
│  └─ NO → Is adoption the issue?
│     ├─ YES → Additional training, simplify workflow
│     │        If no improvement in 4 weeks → KILL
│     │
│     └─ NO → Is the use case inherently wrong?
│        └─ YES → KILL immediately, reallocate budget

Kill Decision: Document learnings, test in different context
Post-Kill Analysis Template:
USE CASE TERMINATION REPORT

Tool: [AI Tool Name]
Use Case: [What we tried to automate]
Duration: [How long we tested]
Total Cost: $X,XXX
Total Value: $X,XXX
Final ROI: X.Xx

WHY IT FAILED
□ Quality issues (specify)
□ Team adoption challenges
□ Complexity exceeded benefit
□ Wrong use case for AI
□ Compliance/regulatory issues

LESSONS LEARNED
1. [What we learned]
2. [What we'd do differently]
3. [Where this might work instead]

BUDGET REALLOCATION
Freed budget: $XXX/month
Reallocated to: [New use case]
Expected ROI: X.Xx
When to Give AI Another Chance:
Sometimes killed use cases deserve a second look:
The key: Don't fall in love with AI for its own sake. Kill ruthlessly, reallocate aggressively, and double down on what works.
The Bottom Line
AI marketing automation isn't about replacing humans or cutting costs to zero. It's about amplifying your team's capabilities—doing more, doing it better, and doing it faster than competitors.
Effective ROI tracking moves beyond vanity metrics to measure real business impact across five layers:
1. Direct cost savings from task automation
2. Quality improvements that increase conversion and engagement
3. Capacity expansion that enables new strategic initiatives
4. Speed advantages that capture competitive opportunities
5. Strategic insights that inform better decisions
Start with baseline measurement, implement tracking infrastructure, and calculate portfolio-level ROI across your entire AI investment—not just the successful experiments.
The teams that master AI ROI measurement gain a compounding advantage: They know what works, double down on high-return applications, and continuously optimize their AI stack for maximum business impact.
--- Related Reading:
- 40 AI Agents Every Growth Team Should Have - Build your AI agent stack
- Training Your Team on AI Tools - Implement AI workflows effectively
- Avoiding AI Content Penalties - Quality control systems that protect your brand
Need help measuring AI ROI for your marketing team? Contact WE•DO for a customized implementation framework.
Ready to Transform Your Growth Strategy?
Let's discuss how AI-powered marketing can accelerate your results.