Automated client reporting is solved. The part clients read isn't.
Part of our guide to AI agents for small business.
Search automated client reporting and page one is dashboard vendors: Rollstack, Improvado, Vendasta, Funnel, ClicData, Teamwork. They're all competent. They all solve the same half of the problem. Numbers from five platforms land in one branded layout, on a schedule.
That was always the easy half.
The hard half is the paragraph above the chart. No connector writes it. A senior analyst does, and it takes 90 minutes a report.
By the end, you'll know:
- Why a dashboard isn't the report your client reads
- The five parts every reporting agent needs
- How our month-end run dropped from five hours to thirty minutes
- How to build one in four weeks
- The four ways it breaks (we've hit all four)
It's about a 9-minute read. If you only need the build plan, skip to the four-week section.
Here's the paragraph a dashboard can't write. Organic sessions rose 23% because three posts landed. The new traffic converts at a third of baseline. The fix is a different CTA (call to action) on the social landing page.
That's the job an AI agent takes. Not the dashboard. The analysis.
We run one. It's called Reporting Roger. It's the highest-return agent in our fleet of 40+ marketing agents. It's also the most boring thing we've ever built (yes, on purpose).
01 / what-does-automated-client-reporting-mean
What Does Automated Client Reporting Mean?
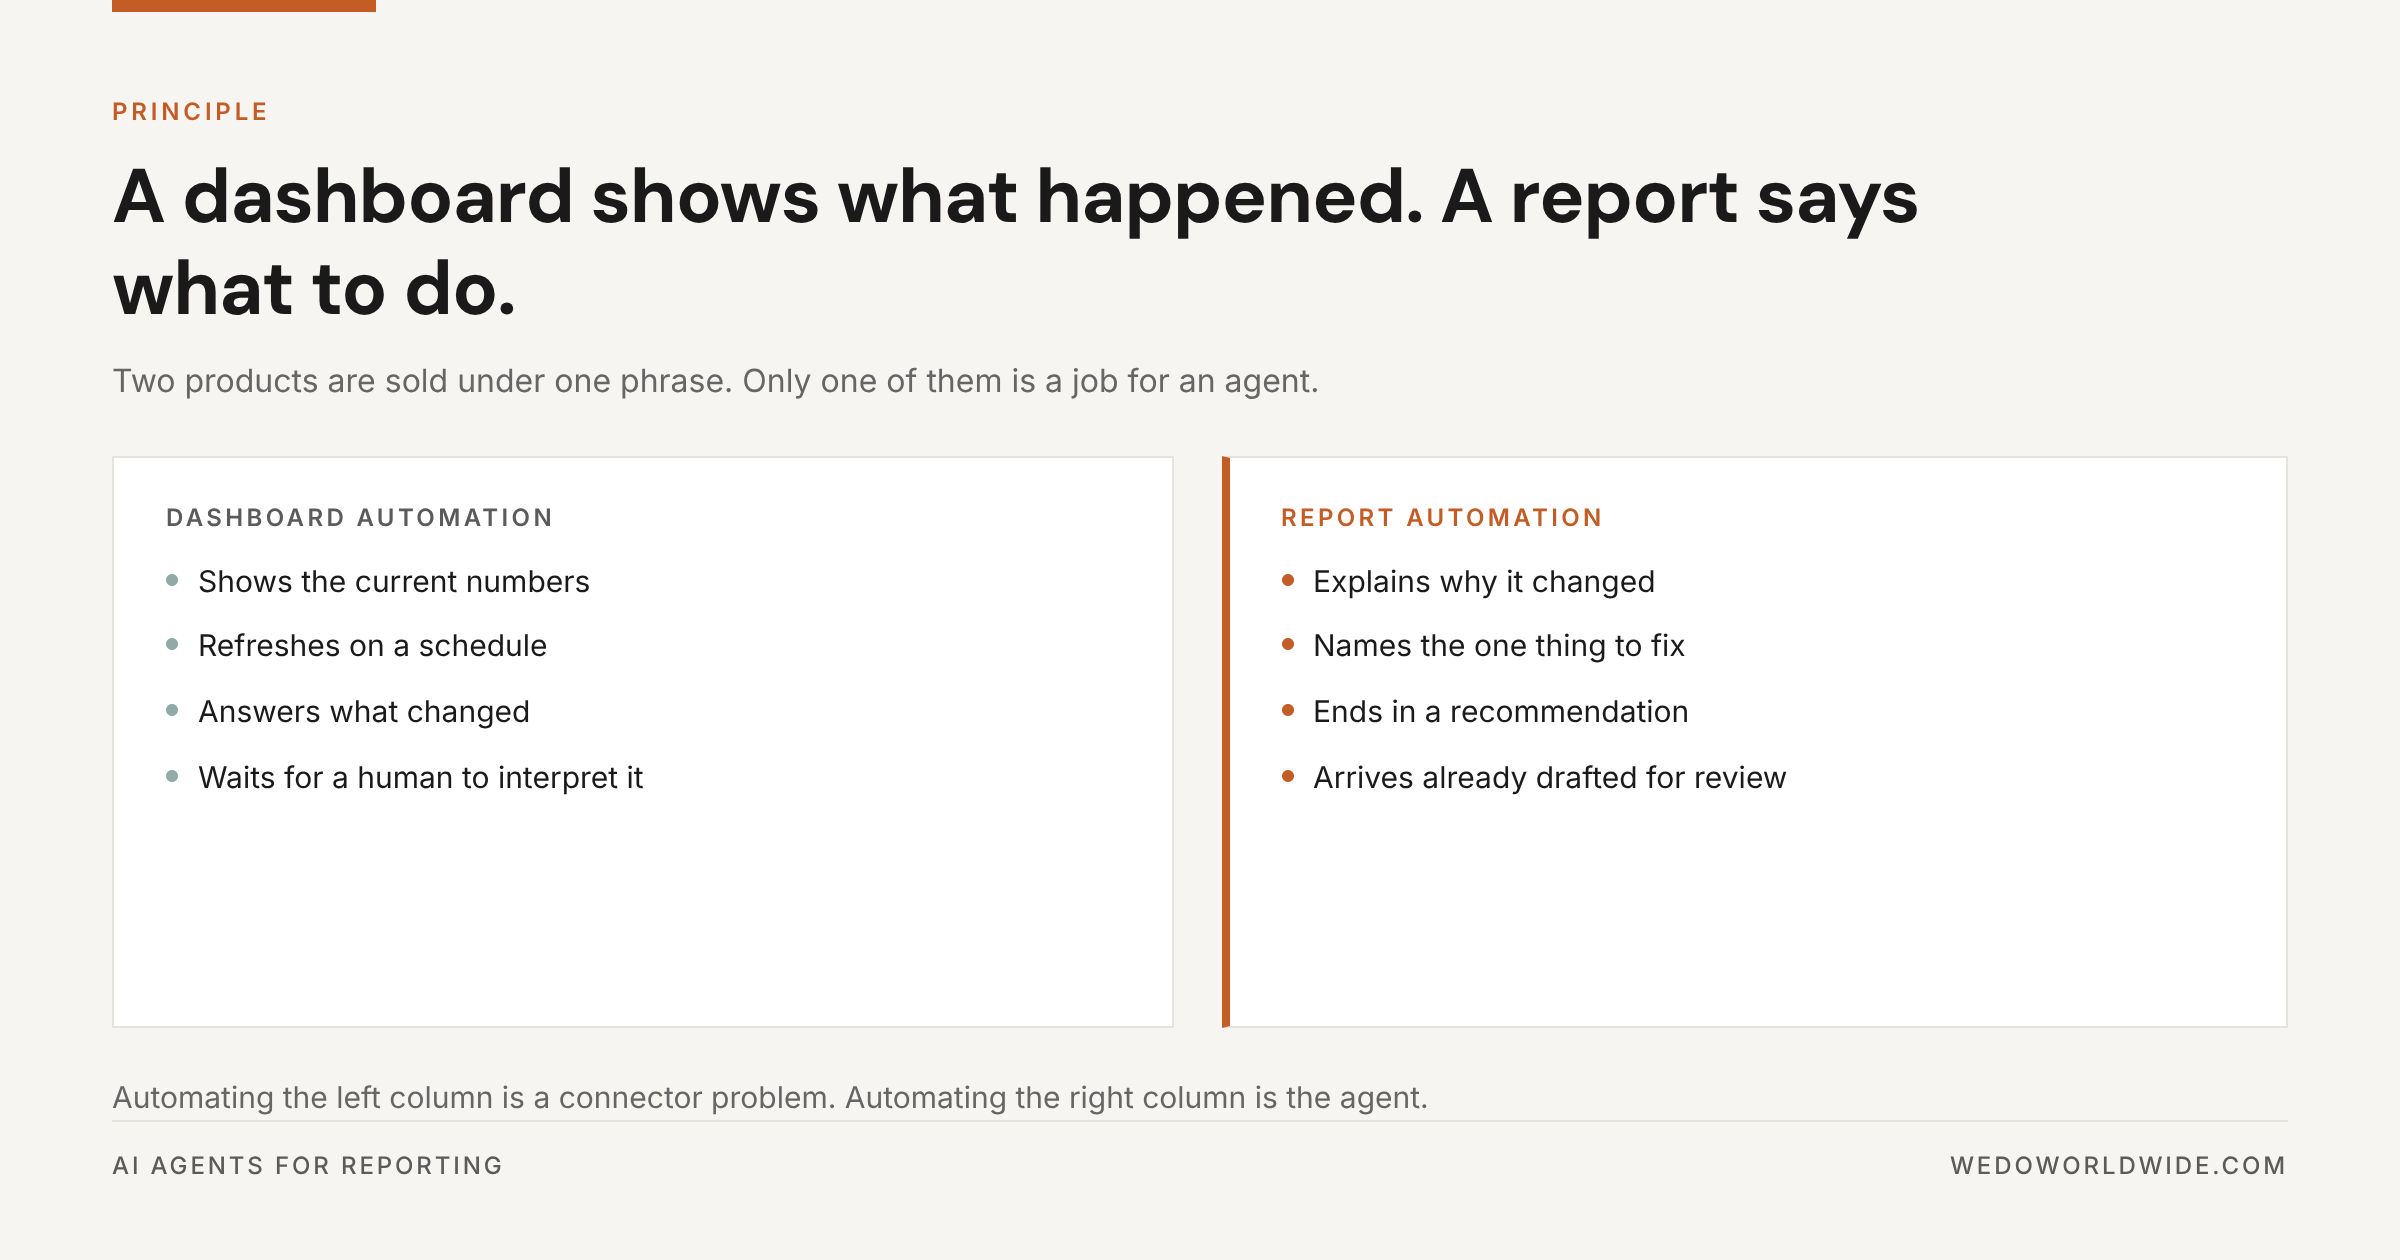
It means two different products sold under one phrase. Mixing them up costs money.
Dashboard automation is a data pipeline. Connect GA4 (Google Analytics 4), Search Console, Ads, and your email platform. Normalize the fields, refresh nightly, publish to a URL. You get current numbers in a consistent layout. It's useful, and it's a commodity. A dozen tools do it well, starting around $79 a month.
Report automation is a different deliverable. You get a document with a point of view. What changed, why, what it means for the quarter, and what you'd do about it on Monday. It ends in a recommendation, not a chart.
Clients read the second one. They bookmark the first and never open it again.
The test we use
If the deliverable ends in a chart, it is a dashboard. If it ends in a decision, it is a report.
Automating a dashboard is a connector problem. Automating a report needs something that can read the data and write the argument, which is why this is an agent job and not an automation job.
02 / why-isnt-the-dashboard-the-deliverable
Why Isn't the Dashboard the Deliverable?
Because it only removes the cheap part of the work. A monthly report done by hand costs about five hours. We broke that down in 100+ client reports a month with no reporting team:
- 45 minutes exporting
- 30 minutes organizing
- 60 minutes building charts
- 90 minutes writing the narrative
- 45 minutes formatting
- 30 minutes on QA (quality checks) and client-specific callouts
Dashboard tools delete the first three lines. That's about two hours and fifteen minutes of the five. The 90-minute narrative, the formatting, and the QA pass all survive. Those are the lines a client pays for.
Run fifty accounts and the math gets loud. Fifty reports at five hours is 250 hours a month. That's more than one full-time person making nothing but reports. Delete the export work and around 137 hours of narrative, formatting, and checking are still left.
That remainder is where a reporting agent earns its keep.
03 / what-does-a-reporting-agent-need
What Does a Reporting Agent Need?
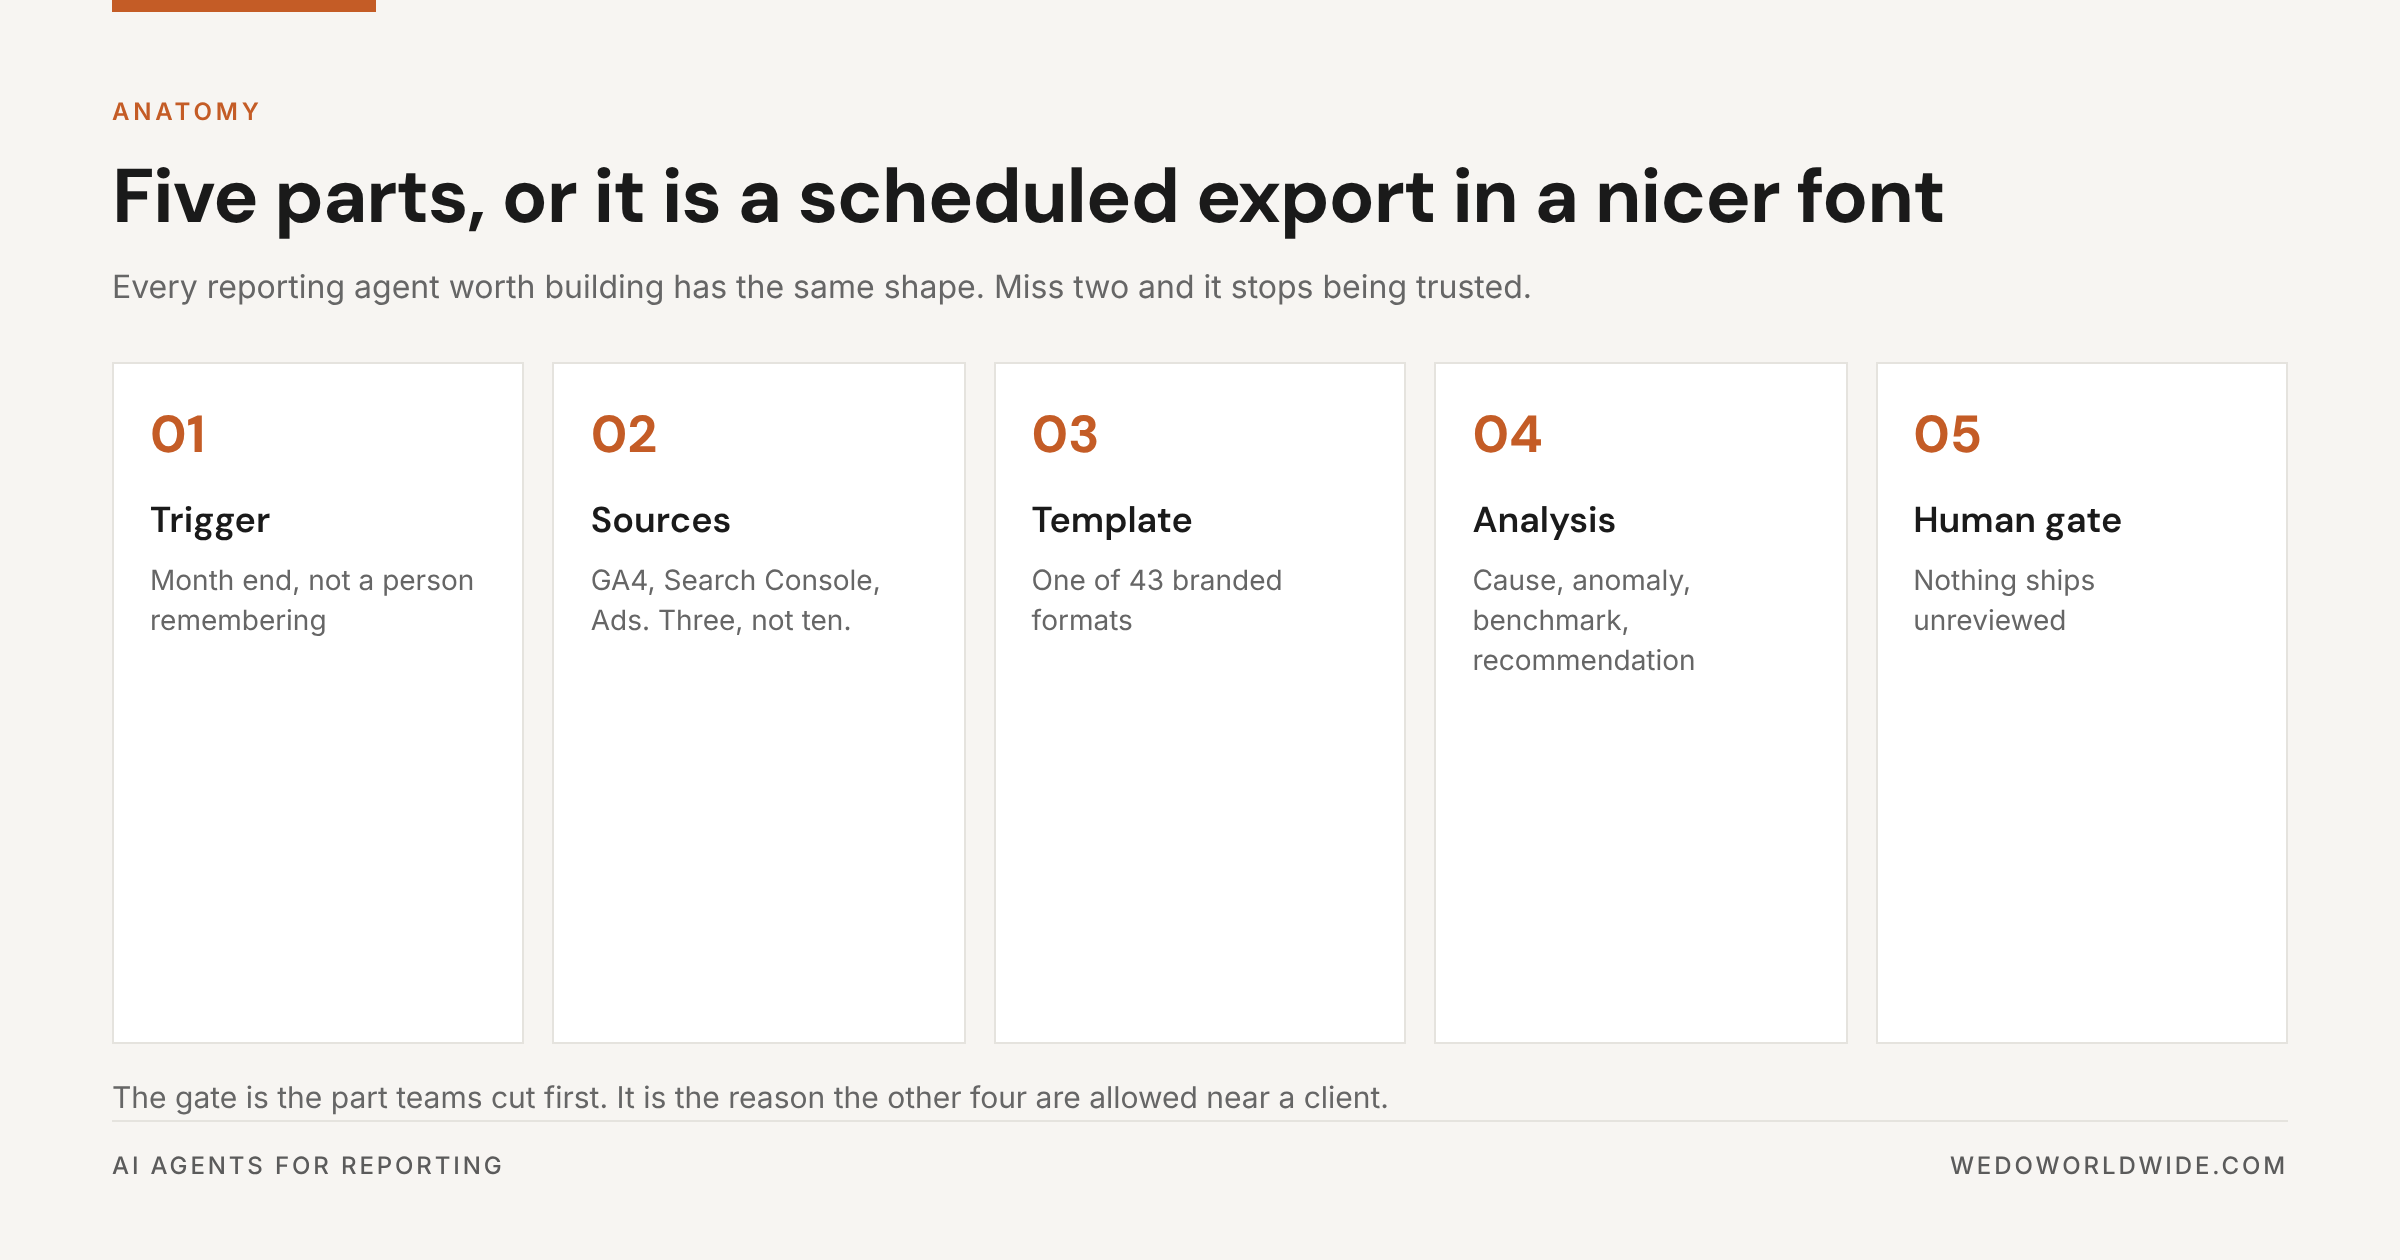
Five parts. Miss two and you have a scheduled export with better branding.
One trigger
Month end, a status change, a data refresh. Something that fires without a person remembering. "The account manager kicks it off" isn't a trigger. It's a reminder with extra steps, and it's the first thing to break in a busy week.
Two or three sources
Ours reads GA4, Google Search Console, and Google Ads. Not ten. Every extra source is another chance to reason from something irrelevant. And in reporting, one confidently wrong sentence can cost a client relationship.
One output format
We run 43 branded report templates: monthly performance, SEO audit, PPC (pay-per-click ads), content, conversion analysis. The template isn't there to look tidy. It's there so someone who didn't build the agent can check what "good" looks like.
A drafted analysis, not a summary
The difference is causation. A summary says sessions rose 23%. An analysis says they rose 23% against a 5% typical variance. It names the driver, compares it to the benchmark, and says what to do next. That's four passes over the same numbers: anomaly detection, trend identification, comparative analysis, recommendation.
A human gate
Every report leaves as a draft. A person checks the key metrics, adds context only they have, and ships it. That step takes 15 to 20 minutes, and it isn't optional. Delegation without oversight isn't delegation.
Every agent worth building has this same five-part shape. That's why reporting shows up first in our breakdown of the seven agent roles for SEO and content teams.
04 / how-does-the-month-end-run-work
How Does the Month-End Run Work?
Five steps, about thirty minutes, in this order.
1. The request carries the context
The account manager names the client, the report type, and the period. Property IDs, credentials, branding, and conversion events already live on the client record. Nothing gets re-entered, so nothing gets mismatched. Two minutes.
2. Data lands in parallel
GA4, Search Console, and Ads are pulled at once, not one after another. The data is normalized into the template, and comparison periods are set automatically. No spreadsheets, no copy-paste, no "which account was this again." Five minutes.
3. The agent drafts the argument
Executive summary, channel analysis, insights, recommendations. This is where anomalies get caught. A third straight month of falling email open rates reads as list fatigue, not a rounding error. The draft says so. Three minutes.
4. A human rewrites the parts only a human knows
Spot-check the key metrics. Adjust the tone. Tie the recommendation to the initiative the client agreed to in August. Reference last week's call. Fifteen to twenty minutes, and it's the whole reason the report is worth sending.
5. Delivery is a link, not an attachment
The finished report deploys to a private URL. The client can open it on a phone and forward it to their team. Attachments get lost and PDFs go stale. Two minutes.
05 / how-much-time-does-it-save
How Much Time Does It Save?
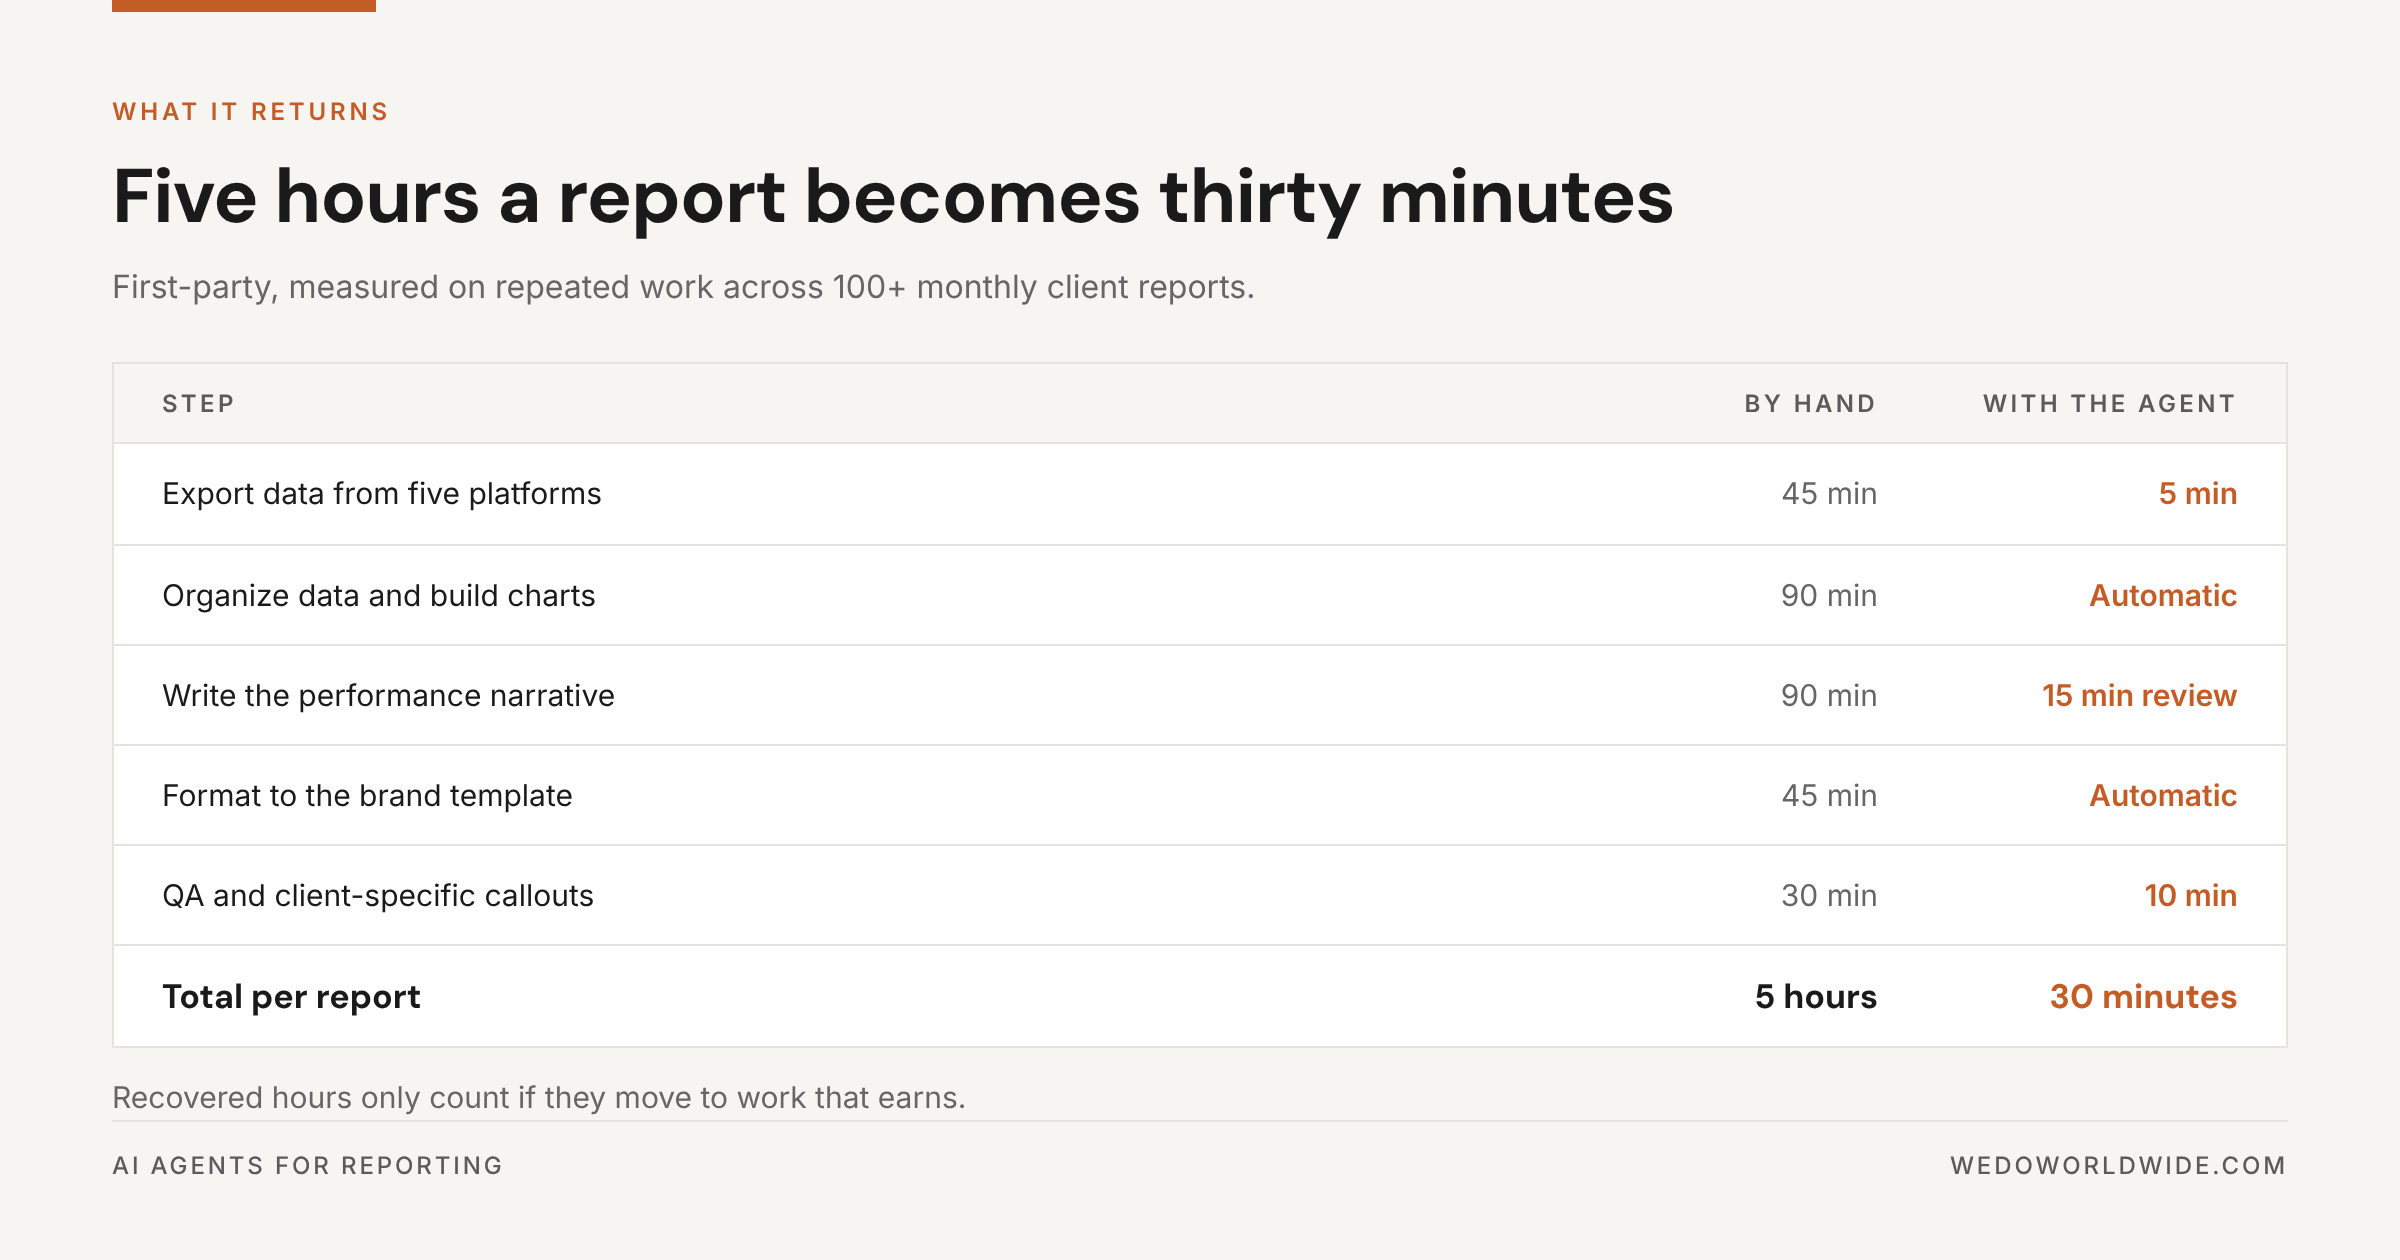
Each report went from five hours to thirty minutes.
| Step | By hand | With the agent |
|---|---|---|
| Export data from five platforms | 45 min | 5 min |
| Organize data and build charts | 90 min | Automatic |
| Write the performance narrative | 90 min | 15 min review |
| Format to the brand template | 45 min | Automatic |
| QA and client-specific callouts | 30 min | 10 min |
| Total per report | 5 hours | 30 minutes |
Thirty minutes, request to delivered link. That's how a team of three ships 100+ branded client reports a month with no reporting department.
The economics, plainly. 100 reports at five hours is 500 hours a month. That's roughly 3.1 full-time analysts, about $232,500 a year in loaded cost (salary plus benefits and overhead). At thirty minutes each, it's 50 hours absorbed into account management. No dedicated reporting headcount. The account team spends the difference on the client's business, not their spreadsheet.
One condition, and everyone skips it
Recovered hours only count if they move to work that earns.
Time that comes back and turns into cleanup is not a saving. The four-line cost breakdown and the break-even math are in what running 40+ agents actually costs and saves.
The full cost and break-even math: what running 40+ agents actually costs and saves.
06 / how-do-you-build-one-in-four-weeks
How Do You Build One in Four Weeks?
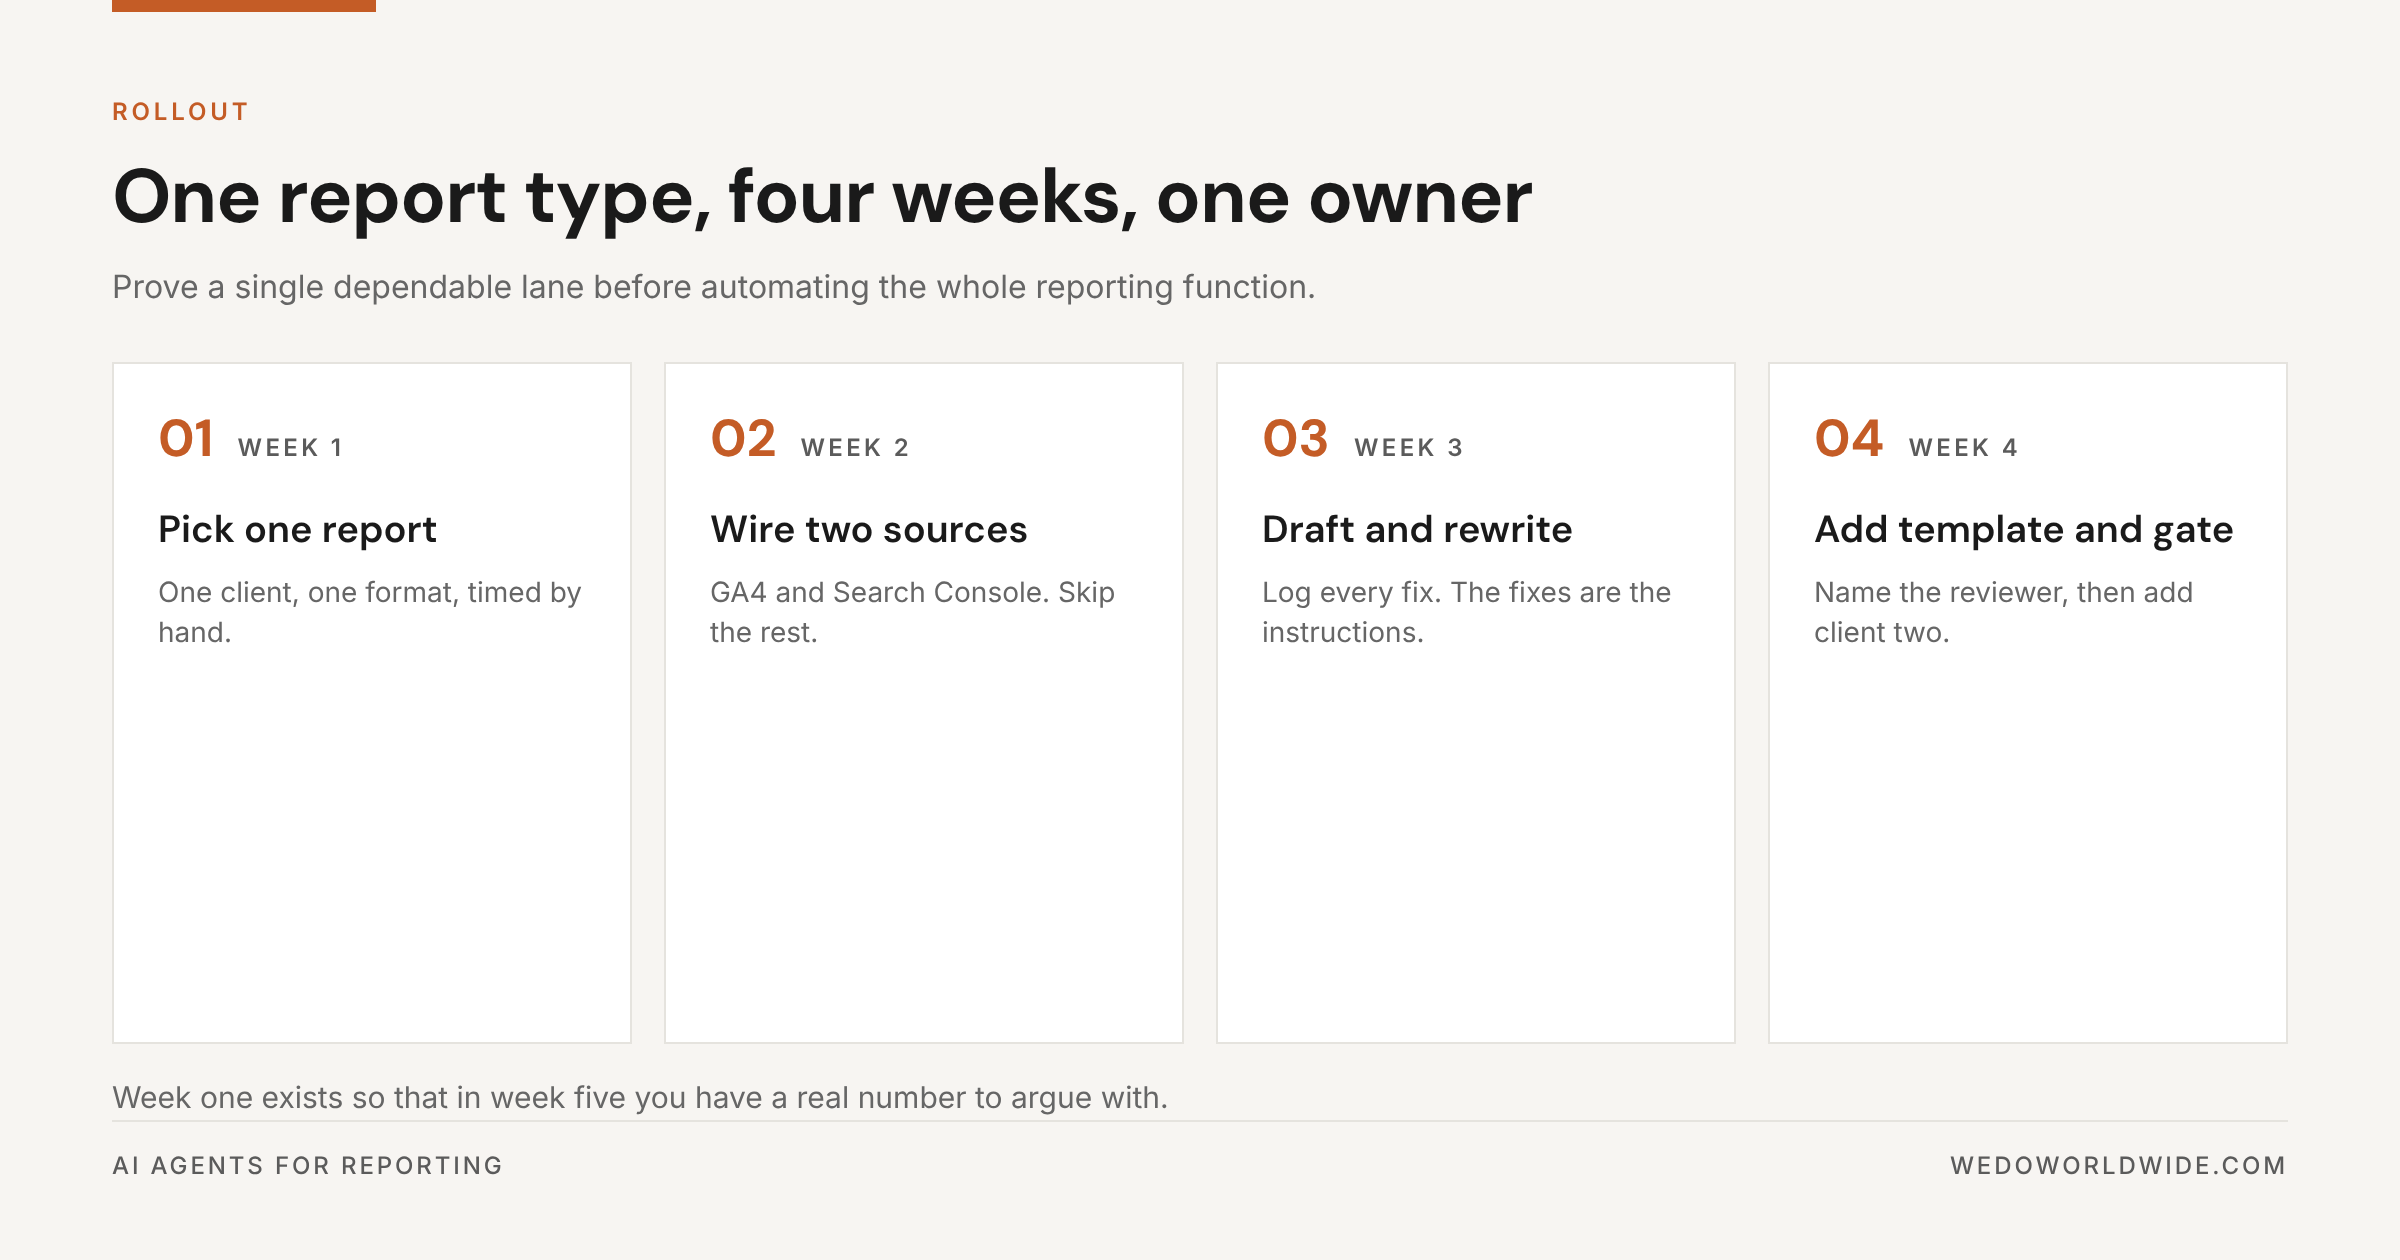
Start with one lane. Not fifty clients and five report types.
- Week 1: pick one report and time it by hand. One client, one format, stopwatch running. You need the baseline. You'll need it again the first time someone asks if this was worth it.
- Week 2: wire two sources. GA4 and Search Console. Skip the rest. If a source only works by manual export, fix that before you touch the analysis.
- Week 3: draft the analysis, then rewrite it. Let the agent write. Rewrite it yourself and log every fix. Those fixes become your instructions. Three or four cycles is normal. The third is usually where it starts sounding like your team.
- Week 4: add the template and the gate. Lock the format, name the reviewer, and define a pass. Then add the second client.
By week four you have a working lane and a real number. Build or buy is a separate decision. The framework is in build versus buy for AI tooling.
07 / where-does-automated-reporting-break
Where Does Automated Reporting Break?
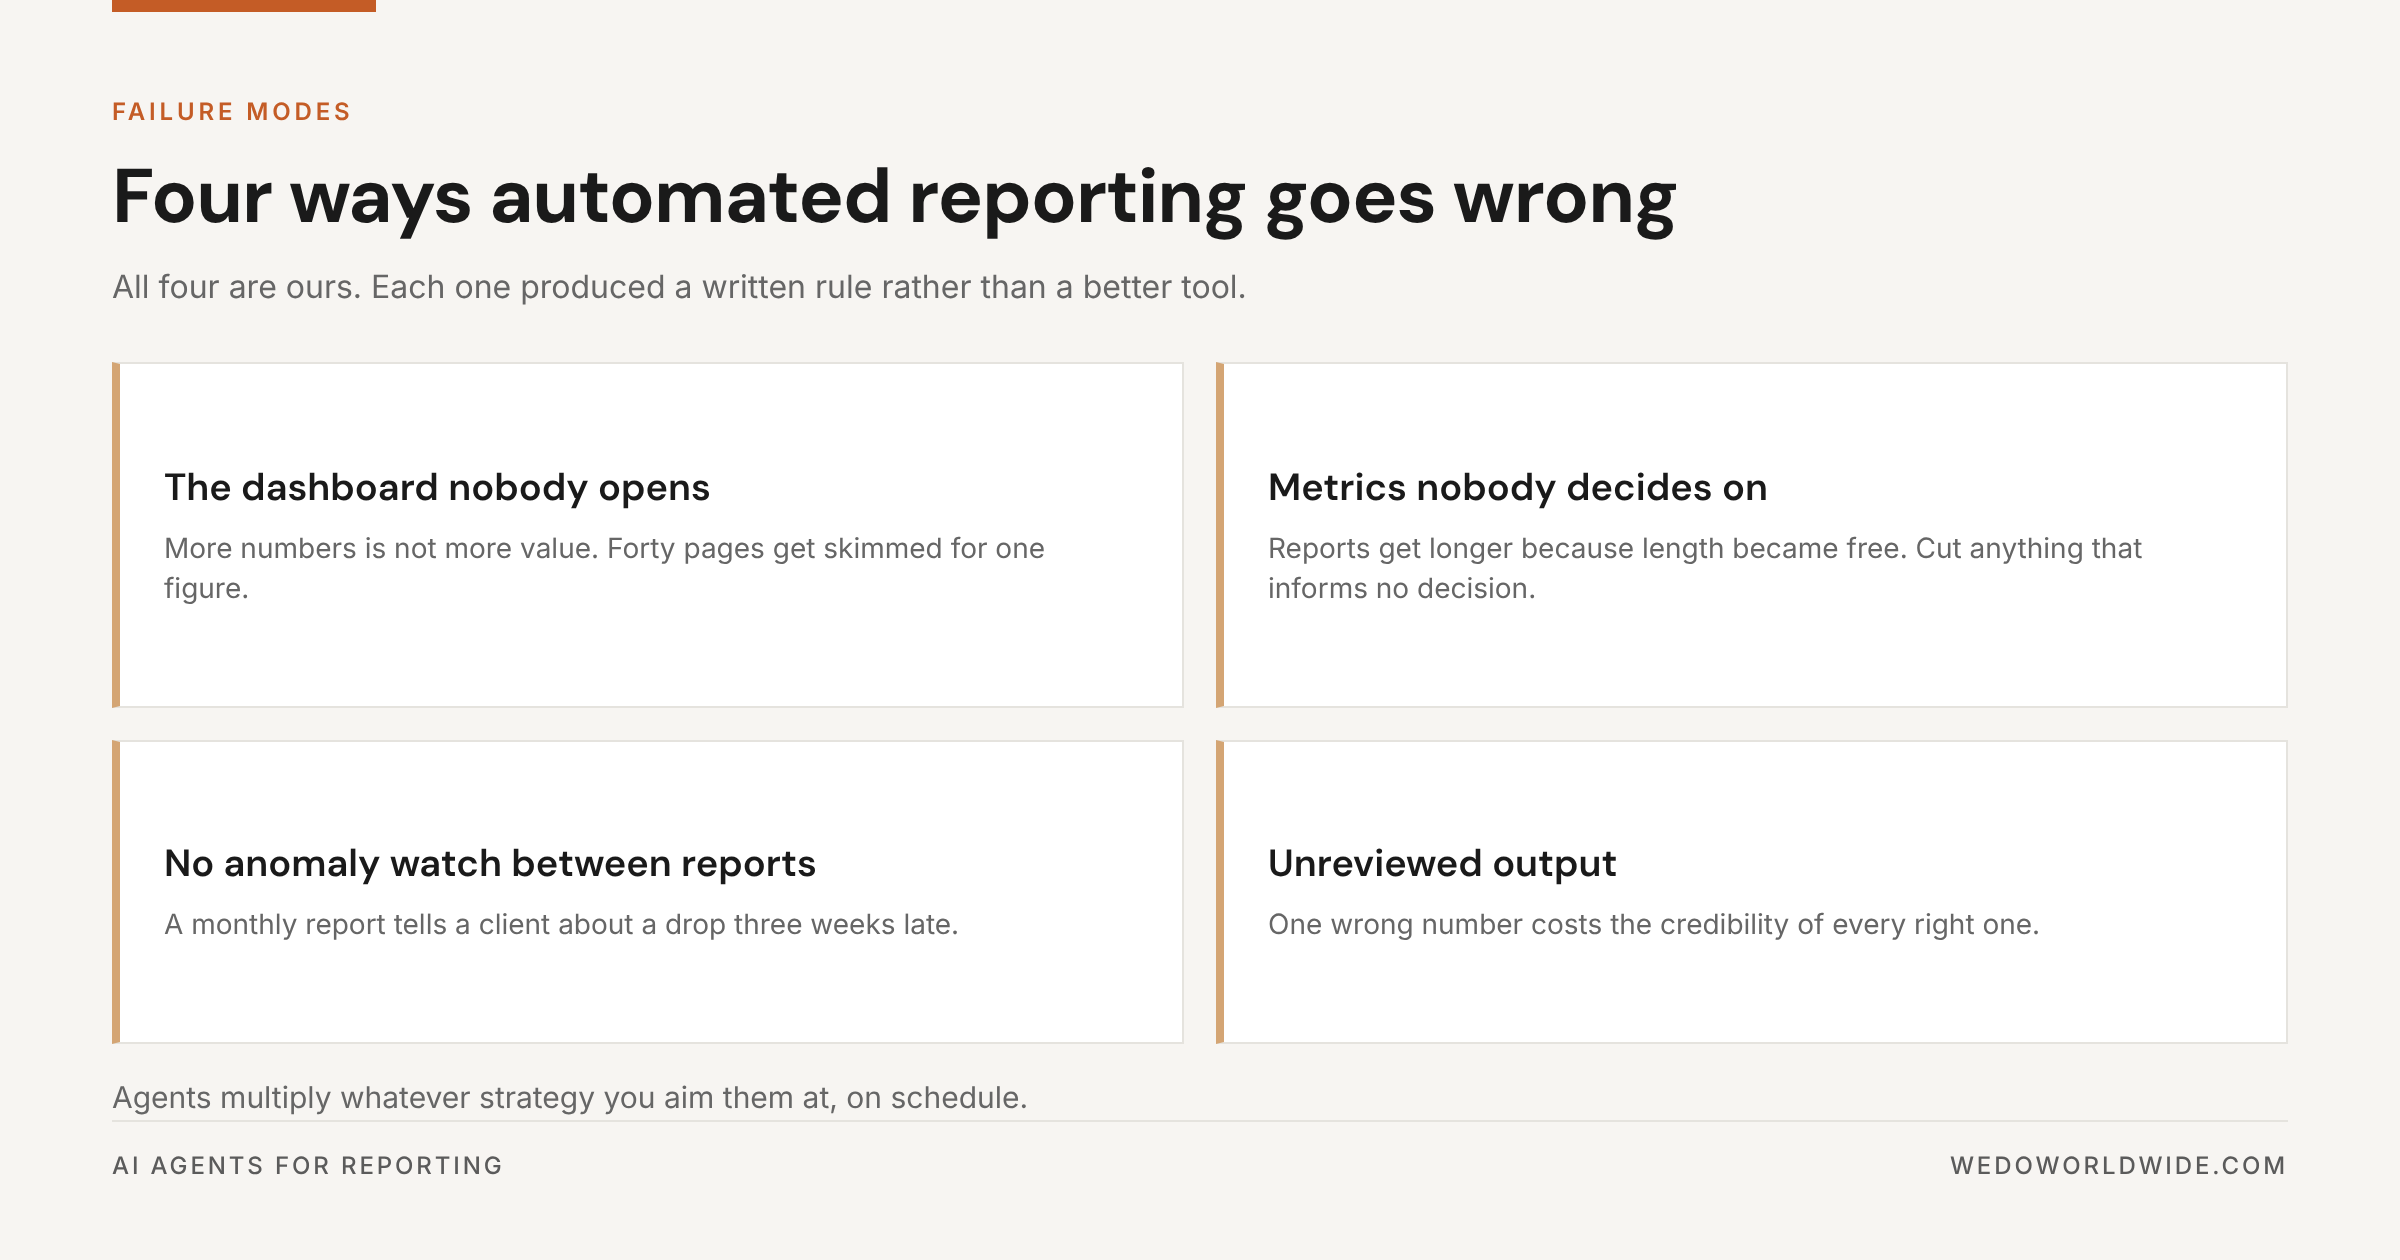
In four places. All four are ours.
The dashboard nobody opens
Automation makes it cheap to send more numbers. More numbers isn't more value. Forty pages of charts get skimmed for the one figure that matters. Insight density beats data volume. It's the same discipline behind turning GA4 data into actionable insight.
Metrics nobody decides on
If a section informs no decision, cut it. This is the most common symptom of a newly automated report. It gets longer because length became free.
No anomaly watch between reports
A monthly report tells a client about a traffic drop three weeks late. So we run a separate agent on the daily data pull. Finding out on the call is the worst way to find out.
Unreviewed output
One wrong number costs the credibility of every right number in the document. That's what the gate is for.
And the honest one, from our own data
13,228 impressions and zero clicks on reporting-intent queries in six months.
Average position 18.9. Our own client reporting post sat at position 10.5 with 99 impressions and no clicks at all. The reporting system works. The content pointing at it was aimed at the wrong terms, and no amount of automation fixes that. Agents multiply whatever strategy you aim them at.
08 / should-you-buy-the-dashboard-or-build-the-agent
Should You Buy the Dashboard or Build the Agent?
Buy the dashboard. Build the agent when the job outgrows it.
If you need the numbers in one place with a monthly narrative attached, that's a product, not a project. Ours is Growth Dashboard at $197 a month. It covers GA4 and Search Console, refreshed nightly, with an executive summary the first week of every month. For page-level tracking on the URLs you care about, there's URL Portfolio Tracker at $297.
If the job is bigger than a dashboard, that's agent territory: your templates, your voice, your data sources, your review step. We build those inside AI Operations. The first step is an audit of which recurring jobs are worth automating and which to leave alone.
Either way, the sequence is the same:
- Standardize the structure.
- Automate the data.
- Let AI draft the analysis.
- Keep a human on the gate.